Tag Archives: nasdaq

Market Lab Report – Premarket Pulse 8/19/15

Major averages fell yesterday on mixed volume. At 2 pm EST, the Fed will release minutes from the July meeting of the Federal Open Market Committee. Some analysts think China’s woes could keep the Fed from raising interest rates next month, but others see it differently. China’s situation “needs to be more brutal for the Fed to really use this as an excuse,” said Naeem Aslam, chief market strategist at AvaTrade. Waning breadth has been an issue for the market for quite some time now as declining stocks continue to outnumber advancers on both the NASDAQ Composite and NYSE, an indication of deteriorating market internals. Norm Fosback’s high-low logic index has also been signaling red flags as the number of new individual stock lows continues to well outweigh the number of new highs. Stock futures are lower ahead of the Fed’s minutes. New Short-Sale Set-Up: Tesla Motors (TSLA) has rallied back up to its 50-day moving average following a gap-down break following its most recent earnings announcement. The rally has been due to an upgrade by Morgan Stanley with a $465 price target, although it is not clear what the drivers for such a price move will be. The stock is currently trading just beyond the 50-day line, and we would use a breakdown back below the line as a signal to initiate a short-sale position using the 50-day line, plus an additional 2-3%, depending on one’s risk preference, to account for “porosity” as an upside stop.

Using Attribution Analysis To Gain Perspective On Actively Managed Funds

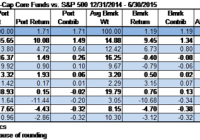
Much has been written about the mass exodus of investors from large-cap actively managed funds over the last several years. For 2014 alone, despite a relatively strong one-year return from the group (+10.72%), investors redeemed some $34.5 billion from actively managed large-cap funds, while they padded the coffers of passively managed funds (+$17.4 billion). Nonetheless, the actively managed large-cap funds group is still the largest group in the equity universe, with $1.6 trillion under management, while its passively managed brethren (excluding S&P 500 Index funds) have a little over $335 billion under management. Although on average passively managed funds have recently outpaced their actively managed counterparts, there are certain times when actively managed funds do indeed outperform. When bull markets start to lose steam and stock picking comes back into vogue or when markets are in a funk, research has shown that actively managed funds are often poised to post better returns than their passively managed counterparts. Year to date through June 30, 2015, in the current sideways market actively managed large-cap funds (+1.95%) have outperformed passively managed (pure index) large-cap funds (+1.33%). Since the performance of active and passive strategies runs in cycles, it’s important to set expectations for clients. To help explain performance trends of actively managed funds vis-à-vis their benchmarks, it’s useful to dive deeper into portfolio practice. For the remainder of this segment we’ll focus on Lipper’s Large-Cap Core Funds (LCCE) classification using attribution-analysis tools. Attribution analysis gives us a way to assign performance qualities to the manager’s portfolio allocation choices (that is, under- or over-allocation to a particular industry, which is referred to as the allocation effect) and to the manager’s stock selection decisions (the selection effect) compared to the composition of the benchmark’s holdings. For 2014, ignoring the impact of expenses on returns, the average actively managed LCCE fund (+13.13%) underperformed the S&P 500 daily reinvested composite (+13.65%) by 52 basis points (bps). In our initial deep dive we note that the average actively managed LCCE fund lagged the benchmark by 2 bps because of allocation effect, while stock selection led to underperformance of 50 bps. In particular, an over-allocation to poorly performing stocks in the finance sector (e.g., Genworth Financial (NYSE: GNW ), Standard Charter ( OTCPK:SCBFF ), and Ocwen Financial (NYSE: OCN )) weighed heavily on active LCCE funds compared with the benchmark, with an economic sector selection effect of minus 51 bps. On the flipside a slight overweighting in consumer discretionary stocks with superior stock returns within the subgroup compared to the benchmark helped the average actively managed LCCE funds’ return, adding 29 bps to the total effect (allocation effect and selection effect combined). However, so far in 2015-and again ignoring expenses-the average actively managed LCCE fund (+1.71%) has outpaced its benchmark (+1.19%) by 52 bps (+28 bps allocation effect and +23 bps selection effect). The average actively managed LCCE fund was slightly over-allocated to healthcare stocks compared to the S&P 500 Index’s allocation, boosting the comparative return 5 bps, while the average portfolio manager’s stock-picking abilities in this sideways market added some 9 bps to the overall return. (click to enlarge) Source: Lipper, a Thomson Reuters company In the analysis above fund expenses are not included in order to provide a true apples-to-apples comparison. This analysis is based on portfolio construction, comparing allocation and stock picking impacts before the consideration of expenses, which are generally easy to assess. Once the trend of the group is found, it is an easy mathematical exercise to slot in expenses. This type of review helps us isolate the pros and cons of various fund groups or individual funds. Attribution analysis can be used as well to highlight funds with superior and inferior performance within a classification, and it can provide a clear explanation of why those findings occurred. As an example, we have identified one of the best performing funds in the LCCE classification over the one-year period ended June 30, 2015, and have run it through attribution analysis to find out how it achieved its outperformance. While this is not a substitution for risk-adjusted return analysis, it provides one more piece of the puzzle, helping us offer detailed explanations to our clients. The following is provided as an example only and is not intended to be a recommendation of any sort. PNC Large Cap Core Fund (MUTF: PLEAX ) posted a one-year return before expenses of 12.66%, while its benchmark-the S&P 500-returned 7.36%. According to attribution analysis, the fund had an allocation effect of 1.28% and a selection effect of 4.02%. While the PNC fund was slightly under-allocated to the information technology sector, providing an allocation effect of minus 0 bps, the portfolio manager’s stock selection within the sector was the primary factor of outperformance, providing a selection effect of 2.51%, with significantly higher weightings to Skyworks Solutions (NASDAQ: SWKS ) and NXP Semiconductors (NASDAQ: NXPI ) being big contributors for the period. Equally, a lower allocation to the underperforming energy sector during the year compared to the benchmark helped the fund mitigate losses to its portfolio, adding 75 bps to the allocation effect. Another, perhaps more recognizable, example is American Funds Investment Company of America (MUTF: AIVSX ) . The fund posts a one-year return of 4.71%, while its benchmark chalks up a 7.36% return. Attribution analysis shows the fund had a negative allocation effect of 1.03% and a negative selection effect of 1.62%. While the fund’s heavier weighting in Merck & Company (NYSE: MRK ) placed a 49-bp drag on the portfolio, it was under-allocated to the healthcare sector compared to its benchmark, tagging on an additional 94 bps of drag from that sector alone. In the passive versus actively managed portfolio debate there are times when one approach is better than the other. Knowing that time can be difficult, so steering clients to both actively and passively managed products can often be the right decision. Providing examples of when certain sectors are out of favor, when markets are flat, or when the manager is truly providing alpha can be shown using attribution analysis, which supports the inclusion of actively managed products. While passive proponents often give the nod to actively managed funds in the less efficient fund groups (emerging markets, small-caps, and municipals), as shown above attribution analysis and good research can help ferret out some hidden gems, even in well-covered, widely held classifications. Editor’s Note: This article discusses one or more securities that do not trade on a major U.S. exchange. Please be aware of the risks associated with these stocks.

5 Overlooked Dividend ETFs Worth Buying Now

With a rates hike on the cards and higher bond yields, the three-year incredible journey of dividend stocks and ETFs hit the brakes in the first half of 2015. In fact, dividend ETFs saw a rough stretch in the same period with outflows of over $2 billion. This is especially true as the Fed is on track to raise interest rates sometime later this year, albeit at a slower pace, provided the job market continues to show improvement. Bond yields have risen for much of this year, taking away the sheen from these stocks. However, the return of volatility in the stock market and uncertainty across the globe has rekindled investors’ love for the products that provide stability and safety in a rocky market. Nothing seems a better strategy than picking dividend-focused products in this kind of an environment. In particular, the Chinese stocks have been on a wild ride over the past few days, Europe is struggling with slower growth, the Japanese economy lost its momentum and many emerging economies is experiencing a slowdown despite rounds of monetary easing. Further, a strong dollar and lower oil prices have added to the global growth worries. Dividend-focused products offer safety in the form of payouts while at the same time provide stability in the form of mature companies that are less volatile to the large swings in the stock prices. The dividend paying securities are the major sources of consistent income for investors to create wealth when returns from the equity market are at risk. This is because the companies that pay dividends generally act as a hedge against economic uncertainty and provide downside protection by offering outsized payouts or sizable yields on a regular basis. That being said, we highlight five dividend ETFs for investors seeking yields and returns in a rocky market. Though investors overlook these funds due to their lower AUM of under $500 million, they yield at least higher than the S&P 500, making them excellent choices in the current market turmoil. iShares Core Dividend Growth ETF (NYSEARCA: DGRO ) This fund provides exposure to the companies having a history of consistently growing dividends by tracking the Morningstar U.S. Dividend Growth Index. Holding 326 stocks in its basket, the fund has a well-diversified exposure across various sectors and securities. Industrials, consumer staples, consumer discretionary, health care and technology are the top five sectors with double-digit allocation each and none of the securities accounts for more than 3.02% of assets. The fund has AUM of $208.9 million and trades in volume of about 50,000 shares. Expense ratio came in at 0.12%. The ETF is modestly up 0.8% in the year-to-date timeframe and has a good dividend yield of 2.26%. It has a Zacks ETF Rank of 3 or ‘Hold’ rating with a Medium risk outlook. PowerShares Dividend Achievers Portfolio ETF (NYSEARCA: PFM ) This fund has amassed $324.1 million in its asset base and trades in lower volume of around 37,000 shares a day on average. Expense ratio came in at 0.55%. The product provides exposure to the companies that have increased their annual dividend for 10 or more consecutive fiscal years by tracking the NASDAQ U.S. Broad Dividend Achievers Index. The fund is widely diversified across various securities, each accounting for less than 4.2% share. From a sector look, about one-fourth of the portfolio is dominated by consumer staples, while industrials (13.5%), energy (11.4%), and information technology (10.7%) round off the next three spots. PFM is down 1.9% so far this year and has an annual dividend yield of 2.13%. The fund has a Zacks ETF Rank of 3 with a Medium risk outlook. FlexShares Quality Dividend Defensive Index ETF (NYSEARCA: QDEF ) With AUM of $192 million, the product fund follows the Northern Trust Quality Dividend Defensive Index, which offers exposure to a high-quality income-oriented portfolio of U.S. stocks with an emphasis on long-term capital growth and a beta higher than the Northern Trust 1250 Index. In total, the fund holds 197 stocks in its basket that are well spread out across securities with none holding more than 4.04% of assets. In terms of sector holdings, financials, information technology, consumer staples, consumer discretionary and health care are the top five sectors. QDEF trades in a paltry volume of about 17,000 shares while charges 37 bps in expense ratio. The fund has gained 1.8% in the year-to-date timeframe and has a good dividend yield of 2.50% per annum. Global X Super Dividend U.S. ETF (NYSEARCA: DIV ) This fund provides exposure to the highest dividend yielding U.S. securities by tracking the INDXX SuperDividend U.S. Low Volatility Index. It has amassed $285.2 million in its asset base while trades in moderate volume of about 94,000 shares. The ETF charges 45 bps in fees per year from investors. Holding 51 securities in its basket, the product is widely diversified across each component as none of these holds more than 2.65% of assets. However, utilities accounts for one-fourth of the portfolio, closely followed by real estate (23%), energy (13%) and consumer staples (12%). The product has a high annual dividend yield of 7.14% and is down about 7% so far this year. It has a Zacks ETF Rank of 3 with a Medium risk outlook. Guggenheim S&P Global Dividend Opportunities Index ETF (NYSEARCA: LVL ) For investors seeking global exposure, LVL seems an intriguing pick. This fund follows the S&P Global Dividend Opportunities Index, holding 99 securities in its basket. It is well diversified across components as each security holds no more than 3.3% share. From a sector look, energy and financials take the top two spots with 27.3% and 22.1% share, respectively. In terms of country exposure, the U.S., Canada, Australia and United Kingdom make up for the top four countries with double-digit exposure each. The ETF has accumulated just $65.5 million in AUM and sees light average daily volume of less than 28,000 shares. It charges 65 bps in fees per year from investors and has an impressive yield of 7.05% per annum. The fund has lost 10.6% in the year-to-date timeframe. Link to the original article on Zacks.com