An ETF That Is A Dividend Growth Investor’s Best Friend
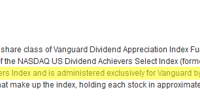
Summary As you might surmise from my chosen pseudonym, ETF Monkey, my portfolio is comprised mostly of ETFs. Awhile back, I gave serious thought to building a “mini ETF” of my own comprised of solid, dividend-paying, stocks. In the end, however, I settled on increasing my weighting in an ETF that I feel may do the job better than I could have done it myself. As probably comes as no surprise, based on my chosen pseudonym of ETF Monkey, my portfolio is comprised mainly of ETFs. In fact, as of this morning, 78.95% of my portfolio is in ETFs. Adding in my cash balance of 12.52%, that means that only 8.53% of my portfolio is in individual stocks. Which individual stocks, and why I selected them, may be the subject of a future article. As a middle-aged and fairly conservative investor, I also love dividends and the solid companies that pay them. Awhile back, I seriously considered carefully selecting perhaps 10 such stocks to add to my portfolio; stocks in companies with solid economic moats, a strong and consistent history of dividend payments, and solid prospects for the future. In other words, the sort of stock that I would be willing to buy and hold for the metaphorical “forever.” I did some work, compared various sources and research, and started to build my list. Long story short, I set it all aside. Why? Because the more I thought about and researched one ETF–ironically, one I already owned–the more I found myself in favor of simply adding weighting in that ETF. And what, pray tell, is this ETF? It is the Vanguard Dividend Appreciation ETF (NYSEARCA: VIG ). Before we dive deep into the details of this particular ETF, let me first quickly address a couple of practical considerations I pondered: Expenses – One of the things I really appreciate about Vanguard is that they offer a wide variety of ETFs–including some that are specialized–at extremely low expense ratios. In the case of VIG, it is a mere .10%. For perspective, if I were to trade my proposed 10 stocks individually, with an $8 commission I would need to trade in chunks of at least $8,000 (per stock) to generate a trading cost of .10%. “Yes, but that is only one time,” I hear some objecting, “not year after year.” This is true, but that leads me to.. Stock Selection – Selecting 10 individual stocks would mean I would first need to narrow down my choices from a large number of candidates and buy them. But it would not stop there. Moving forward, I would need to track them and make future decisions, likely involving more trades. This could range from simple re-weighting, as needed, all the way to the question of whether I had made a bad choice (or two) and really should swap it for something else. Now, before I go any further, a caveat. I will explain the choice I made. That doesn’t mean the choice is right for everyone. But, for me, I was not convinced that I would necessarily be able to do better than to pick a high-quality ETF that attempted to do the same thing. So, I decided to see if I could find one that matched the philosophy of what I wished to accomplish. Ultimately, as mentioned, I settled on VIG. “But There Are ETFs With Higher Dividend Payouts” Please allow me to anticipate one potential objection and get it out of the way right away. VIG does not have the highest current dividend ratio of many of the specialized ETFs that play in this area. In fact, Vanguard’s factsheet for VIG reveals a 30-Day SEC Yield of “only” 2.19% as of 8/17/15. For me, though, today’s yield is not the main consideration. You see, every single company in the base index from which this fund is built has a history of “at least 10 consecutive years of increasing annual regular dividend payments.” Such a track record speaks volumes about the financial management of these companies. Not only does it mean that they have a history of rewarding shareholders, but it also means that they run their businesses with a great deal of financial discipline. Think about one last thing before we leave this section. Such a history over 10 years means that these companies maintained this record through the horrible downturn from 2007-2009. In summary, I made a decision that I wanted to think with a view to the long term, and select the type of companies that would give me a great chance of reaching my goals. A Truly Unique ETF As it turns out, VIG is truly a unique ETF. I stumbled across a very interesting tidbit when I took a look at VIG’s investment strategy and policy page. (click to enlarge) That stopped me in my tracks. Is it really the case that there is an index administered exclusively for Vanguard? Turns out, there is. Here, from the methodology fact sheet for the NASDAQ U.S. Dividend Achievers Select Index , is the eligibility criteria: (click to enlarge) Note that last bullet; “additional proprietary eligibility.” To confirm this, if you look at the overview sheet for the index, you will see that only one ETF product is based on that index; VIG. Here are a couple of other points of interest about the index: A thorough evaluation of all securities in the index is performed every March. All resulting additions or deletions are effective after the close of trading on the third Friday in March. However, a security which ceases to meet the criteria for inclusion in the index may be removed at any time during the year. The portfolio is rebalanced annually such that the maximum weight of any security in the index does not exceed 4%. This takes place as of the last trading day in February. Composition With 181 securities in both the index and fund, VIG is fairly focused. It forms a nice addition to a portfolio that is anchored by a “total market” ETF, such as the Vanguard Total Stock Market ETF (NYSEARCA: VTI ). Here are a couple of extremely helpful screen shots with more details on the fund’s composition. First, from the latest fact sheet Vanguard provides to institutions . What I liked about this presentation is that it captured both the Top-10 holdings and sector breakdown right next to each other: (click to enlarge) A couple of quick observations: You may note that Microsoft has temporarily exceeded the 4% maximum weighting target. This will automatically remedied, if appropriate, at the annual rebalancing process. This index excludes REITs. I like that because it allows you to add REITs separately if desired, using an ETF such as Vanguard REIT Index ETF (NYSEARCA: VNQ ). The index notes make it clear that this decision was made because REIT dividends do not enjoy the same tax advantages as corporate dividends and, therefore, that you may not wish to include REITs in a taxable account. Here’s the second picture, from the fact sheet for the index itself. Please note the decided tilt toward large-cap securities. Performance As we sit with the U.S. market close to historical highs, and with many observers theorizing that it may be a little “frothy” at the moment, it is certainly valid to ask how VIG might perform in the event of a correction, or worse. If history is any indicator, it may do reasonably well. Here is a chart showing VIG’s performance against the S&P 500 index during the severe downturn the market experienced between 10/1/2007 and the bottom on 3/9/2009. VIG data by YCharts While the downturn was dramatic in all cases, VIG managed to outperform by some 8.5% over that period, not including dividend distributions. To be fair, though, let’s look at the other side of the coin. How have both fared since the historical bottom on March 9, 2009? Have a look at this chart. VIG data by YCharts Clearly, in rising markets, VIG tends to underperform. Of course, this analysis also excludes dividend distributions. Given where the market sits at the present time, I feel good about having something I view as at least slightly defensive in my portfolio. Summary and Conclusion As mentioned in the outset, I looked long and hard at building what I might describe as a “mini ETF” of dividend paying stocks for myself. The more I looked at VIG, however, the more I wondered if I genuinely could do better. VIG contains the kind of stocks I want as underpinnings of my portfolio. Since I will only have to trade it very intermittently, it will keep my trading costs low. And that low .10% expense ratio, to me, is a small price to pay for having a diversified base of 180 or so of these types of stocks, in industries I like, and rebalanced as necessary for me. What about you? I’d love to hear your thoughts. Happy investing! Disclosure: I am/we are long VIG, VNQ, VTI. (More…) I wrote this article myself, and it expresses my own opinions. I am not receiving compensation for it (other than from Seeking Alpha). I have no business relationship with any company whose stock is mentioned in this article. Additional disclosure: I am not a registered investment advisor or broker/dealer. Readers are advised that the material contained herein should be used solely for informational purposes, and to consult with their personal tax or financial advisors as to its applicability to their circumstances. Investing involves risk, including the loss of principal.