Market Lab Report – Pocket Pivot and BGU Weekly Review for 11/15/15
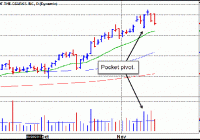
Trading Journal notes from Gil Morales and Chris Kacher regarding recent pocket pivots and buyable gap-ups for the week of 11/9 – 11/15/15: General comments : GM – Most of the recent pocket pivots and buyable gap-ups we have seen have either gone nowhere or declined since early October, even as the general market indexes have been in a strong rally since late September. In fact, the rally has been led by big-cap NASDAQ names, and over the past three days. Here’s a simple breakdown of pocket pivots since early October, just after the general market lows of late September: Down: OZRK, CDW, CTSH, DHI, PLAY, ELLI, NCLH, ORLY, PFGC, SHOP, SBUX, TTWO, TYL, ULTA Flat: STZ, EEFT, HELE, TREE. Up: AYI, DY, FB, GDDY, IDTI, LXFT, MANH, ULTI. While this is not necessarily terrible, we can still conclude that most pocket pivots and buyable gap-ups have not led to significant upside gains. AYI, FB (on the pocket pivot breakout at 97), and MANH have probably performed the best, but keep in mind also that FB most recently failed on a buyable gap-up around the 108 price area.  The main issue for most of these names is whether they are representative of the type of dynamic new leadership that tends to lead robust market rallies. A lot of this just strikes me as rotational in a market where making big money is a difficult proposition.  DRK – Continuing that thought, the best way to make money the last 2 years has been to be quick about taking profits in context with the chart and general market as we have discussed each week in our webinars. Developing one’s chart eye is essential so one can see when a stock gets ahead of itself in price in proper context. The actionable stocks for this week (OZRK, DHI, STZ) pulled back along with the market on Thursday and Friday, some to support points. LXFT put in the strongest showing as it was up on Thursday and only down a bit on Friday. Its buyable gap up on Wednesday perhaps gave it more strength to buck the weakness in the general market.  GM – OZRK is a financial name, and financials are expected to benefit from higher interest rates. However, this is dependent on what the Fed does in December, and in my view this is not conclusive. One could just as easily buy the Financial Select Sector SPDR Fund (XLF) to play any rising interest rate scenario. Objectively OZRK sold off hard on Wednesday and is now coming into the 20-day moving average. The main issue I would have with this recent pocket pivot is that it is occurring within a reasonably strong and extended prior uptrend. In this market gains like that don’t necessarily have much in the way of sustaining power. DRK – CME FedWatch shows a 70% chance of a rate hike when the Fed meets in December, far from a sure thing. OZRK’s mini-gap lower on Thursday closed near its low on the highest volume in a few weeks, a negative, though the S&P 500 was sharply lower on higher volume both Thursday and Friday, yet OZRK managed to get support at its 10dma. If you own this one, keep your stops tight, perhaps at an undercut of Friday’s low. With the Paris and Beirut news, markets could gap lower at Monday’s open. GM – STZ is a beverage stock, hence is considered a defensive consumer staple type of name. Tuesday’s pocket pivot has led to little more than a pullback into the 50-day moving average as volume dries up. Theoretically, this would present a lower-risk entry point following the pocket pivot, assuming the stock is able to hold the 50-day line. DRK – Again, keep your stops tight if you own this or plan to buy it near its closing price at the 50dma. If it pierces the 50dma, in a weak market, it can slice right through so be quick to sell should it pierce its 50dma support. GM – DHI pocket pivoted after beating earnings estimates by a penny on Tuesday, while guiding lower on revenues. The company also raised their stock dividend. Despite the strong earnings report, DHI was not able to break out of its current base, and has slipped back towards the 50-day line as volume dries up, which objectively brings it back into a low-risk buy position after the prior pocket pivot. DRK – This is a lower risk entry but only if you sell should it pierce its 50dma. Your risk would then be less than 1% assuming you buy it near its Friday’s closing price. Notice how the pattern has been a bit wide and loose, thus could easily fall to the bottom of its base should it pierce support at its 50dma. GM – I think its helpful to review FB since it has had two buy signals over the past month. The first was a pocket pivot breakout back in mid-October, and the latest was a buyable gap-up move following earnings. While FB was able to make reasonable progress (more than 10%) from its pocket pivot breakout around the 97 price area, the more recent BGU has now failed. FB was hit with some above-average selling volume on Friday as the stock broke down through the 10-day line and met up with the 20-day line. This could fail altogether here if it cannot hold the 20-day line, perhaps bringing the stock into play as a short-sale target. DRK – In context with the chart and general market, a stock’s BGU can be held if it does not break below the low of the gap up day by more than 2-3%. A 3% undercut would be 104.7 which FB blew through on Friday on higher volume. It sits at its 20dma. If you own this, your stop should be tight such as a piercing of its 20dma or roughly a sell stop around 103.5. Of course, if markets open lower on Monday and FB gaps lower along with other stocks, that is no excuse to hold onto it hoping it will bounce.Â