Market Lab Report – Pocket Pivot Review for the Week of 11/16-11/20 2015
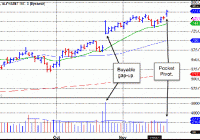
Trading Journal notes from Dr. K and Gil regarding this past week’s pocket pivot reports. Pocket Pivots: Alphabet (GOOGL) DRK – supercap technology stocks have been leading the market as shown in the performance of the NASDAQ-100 which is comprised of the larger cap tech stocks. GOOGL gapped higher on its prior earnings report and has since moved higher. In a risk-on environment, the largest cap leading names tend to outperform the smaller cap names as the Russell 2000 has been severely lagging. GM – this pocket pivot is coming off the 10-day line in continuation fashion following a buyable gap-up after the company announced earnings in late October. In a case like this my preference would be to buy the supporting day at the 20-day moving average five days ago on the chart while looking for some sort of low-volume pullback into the 10-day line as a lower-risk entry. Luxoft Holdings (LXFT) DRK – stock gapped higher on its prior earnings report, and since has traded sideways in constructive fashion. Its pocket pivot if still within the sideways consolidation so could have been bought. Since 5 days have passed since the gap higher, should the stock break below the low of the gap up day, it should be sold. A 2-3% allowance under the low of the gap up day is allowed if it occurs within 5 days after the gap up day. GM – company is a small player in outsourced IT services and relatively thinly traded at about 229,000 shares a day. I’ve noticed that the spread on this puppy can get as much as 40-50 cents wide during certain times of the day, which makes it a little difficult to buy or sell at times. But it may be “revving up” to move higher with a number of pocket pivots and a buyable gap-up in the pattern. ServiceNow (NOW) DRK – breaking out to new highs so is extended. It could be bought on a pullback to its 10dma. GM – This is probably best bought on low-volume pullbacks into the 10-day line. Notice how trying to chase Wednesday’s pocket pivot as the stock moved higher on Thursday or Friday was probably late as the stock stalled out and closed at the lows of its trading range on both of those days. INC Research Holdings (INCR) DRK – just broke above its double bottom midpoint. The right side of double bottoms should have stronger upside thrust especially in an uptrending market. This is a sign of weakness in the pattern. On the other hand, earnings have been soaring over the last several quarters, but keep in mind that future earnings surprises are more important than what everyone already knows. GM – this stock is actually trying to break out through the mid-point of a double-bottom type of base. The middle peak of the “W” in the double-bottom is the peak at the right of the chart, and you can see how the stock broke out through that high on above-average volume on Friday. Of course, buying as close to the 10-day line as possible following the pocket pivot on Tuesday gets you in earlier. Integrated Device Technology (IDTI) DRK – this gapped higher on its prior earnings report, then undercut the low of the gap up day by -2.6% so could have been held. It is now extended as it breaks out to new highs. GM – this has been one of the strongest semiconductor names in the market since early October, and we have reported on this several times on the way up as it has flashed pocket pivots along the 10-day line. Tuesday’s pocket pivot led to a breakout later in the week, so from here you’d want to wait for a low-volume pullback back into the 10-day line. Â