Tag Archives: management

MTS4: Systemic Market-Timing For All Investors
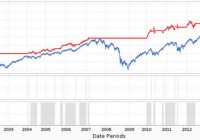
What are Multi Timing Scores. Why they are safer than the usual market-timing indicators. An actionable example. Multi Timing Scores are multi-valued market timing indicators focused on a long-term investing horizon, including the 4 main categories of market analysis: sentiment, economy, fundamentals, technicals. They count bearish signals among a set of elementary indicators based on economic data and S&P 500 companies. Indicators are chosen based on publications and consensus, they are not optimized. Multi Timing Scores gather them and makes the assumption that any of them may be wrong at any time, but not most of them at the same time. By definition, a systemic model is a model able to cope with complexity, which implies coping with uncertainty. Market timing scores take into account uncertainty about signals, and even that an indicator may be irrelevant. This makes them not only systemic, but also more robust than usual optimized indicators. Another characteristic of Multi Timing Scores is that they are multi-valued. The usual market-timing indicators are binary: they tell when you should be in or out of the market. Market conditions are more complex than risk-on / risk-off. Multi Timing Scores do not aim at making predictions, but at telling when the ecosystem is favorable to black swans. They can be considered as risk indicators, but the risk is not necessarily proportional to the score. The best way to understand Multi Timing Scores is to compare them with another score well-known by back-country skiers and mountaineers: the avalanche danger scale. When the level is maximum, it is strongly recommended to stay at home. But even when it is at its lowest value, zero risk does not exist. Fortunately the danger is less acute in investing. Mountains (a tough school of risk management) teach something else: regarding risk, expertise and experience don’t matter. Accident reports show that experts and professionals have more or less the same risk as beginners. Knowledge and routine are an advantage, except when they lead to an excess of confidence. Hence, the importance of having an objective view of risk built on facts and indicators, and always keeping in mind that zero risk does not exist. Market Timing Scores can be used in two ways: Defining an alarm level : the indicator value beyond which the benchmark average return is negative. It can be used to go in cash or take a hedge. The calculation is dependent of a backtest period. Hedging by thresholds. The hedge (for example shorting a stock index) is sized depending on the indicator value. Various tactics are possible, and backtesting may help make a better choice depending on the priority: risk reduction, drawdown duration reduction or return maximization. I will disclose now a simple and actionable version of Multi Timing Score with 4 components: MTS4. It is calculated from 4 elementary values (a,b,c,d) defined as follows: If the unemployment rate is above its value 3 months earlier, then a=1; else a=0. If S&P 500’s current-year EPS estimate is below its value 3 months earlier, then b=1; else b=0. If S&P 500’s 50-day sma is below the 200-day sma, then c=1; else c=0. If the 52-week sma of S&P 500 companies’ average short interest is above the 104-week sma, then d=1; else d=0. MTS4 is simply the sum a+b+c+d. As a consequence, it is an integer between 0 and 4. Readers willing more insights on the choice of elementary indicators can refer to this article and this other one . The charts and table hereafter report simulations of SPY when MTS4 =n+1. The period includes only 2 market cycles (01/01/2001 to 07/22/2015). Most components have been chosen from academic or professional publications studying elementary indicators on longer periods. Data and charts: portfolio123 MTS4=0: (click to enlarge) MTS4

RSX: Expect More Weakness

Oil continues to trend lower. The Russian ruble is also weak. There has not been more panic in the Russian market yet, but this does not mean that there will be no panic at all when oil drops further. I published my initial bear thesis on the Russian market (NYSE: RSX ) on June 26. Things went as I expected and RSX declined 9% since then. I must admit that RSX held fairly well, as oil prices declined and the economy showed no signs of rebound. However, I think we will see the true downside potential of RSX later. It is obvious that while RSX declined this month, there was no panic. The decline of the Russian market is by no means comparable to the recent performance of the Chinese market , although the state of affairs for the Russian economy is far worse than for the Chinese economy. My explanation for this is the lack of players on the Russian market. Russian market went out of favor after the oil crash of 2008 – 2009 and never really recovered in terms of trading activity. Recent data ( Google translate link ) from the Moscow Stock Exchange confirms this thesis. For example, the volume of stock trading declined by as much as 22% in May 2015 compared to May 2014. In my view, a significant number of investors who wanted to get out of Russia already completed this task. It also turns out that the rebound from December 2014 lows was on low volume, which means that there are less players to panic when things go south. However, this also means that there will be less liquidity on the market in case of negative events. The main risk for the Russian market is the continuing decline in the price of oil. The decline in oil price hurts RSX in two ways. The first one is obvious, as RSX has 43.54% of its portfolio in Russian energy companies. The second blow is the damage that low oil prices do to economy, hurting almost every other company in the portfolio of RSX. There have recently been additional negative news for the retailer Magnit, which accounts for 7.62% of RSX holding. Sergey Galitsky, the founder of Magnit, told ( Google translate link ) the press that the company could work without him. For Magnit, Galitsky is the same that Steve Jobs was for Apple, and his departure could seriously hurt the business, especially in the Russian business reality, where a lot depends on individuals and not on processes. Back to oil. Here and there I read bullish articles on oil. The main bullish argument is that oil prices are too low to stimulate investment, which will ultimately lead to a rebound. If we think about a five or ten year period, then I agree with this statement. If we talk about next few years, this might not be the case. The examples of coal and iron ore markets showed us how long prices could decline despite the fact that producers are losing money. Also, producers with lower costs could try and increase production in order to make some additional money. In severe downturns, costs also go down fast. For my thesis to be valid, oil does not need to be in a severe downtrend for years. In my view, low oil prices until the end of this year will be enough to bring RSX back to the lows of December 2014. So far, everything went according to plan in the RSX trade. I think that there’s more weakness to come, as the decline of oil prices pressures Russian economy and the Russian ruble. Disclosure: I am/we are short RSX. (More…) I wrote this article myself, and it expresses my own opinions. I am not receiving compensation for it (other than from Seeking Alpha). I have no business relationship with any company whose stock is mentioned in this article.

More Interest Rate Hedged ETFs Come To Market

Bond ETFs could take a hit in a rising interest rate environment. BlackRock’s iShares launches two new interest rate hedged bond ETFs. A look at the iShares Interest Rate Hedged Emerging Markets Bond ETF and Interest Rate Hedged 10+ Year Credit Bond ETF to generate yields and hedge against higher rates. With Treasury yields rising in anticipation of the Federal Reserve potentially boosting interest rates later this year, issuers of exchange traded funds continue to meet advisors and investors for alternative fixed income exposure with interest rate hedged ETFs. BlackRock’s (NYSE: BLK ) iShares, the world’s largest ETF issuer, doubled the size of its interest rate hedged ETF lineup with the debuts of iShares Interest Rate Hedged Emerging Markets Bond ETF (NYSEArca: EMBH ) and the iShares Interest Rate Hedged 10+ Year Credit Bond ETF (NYSEArca: CLYH ) . Both are actively managed funds. Unlike traditional bond ETFs, the rate-hedged bond ETFs try to mitigate the negative effects of a rising rate environment through shorting Treasury futures to match the overall duration of their diversified bond holdings. Looking further out, these types of hedged-bond ETFs could provide suitable exposure to the fixed-income market in a rising interest environment, especially as the Federal Reserve plans on hiking rates sometime later this year. The iShares Interest Rate Hedged 10+ Year Credit Bond ETF “seeks to provide exposure to long-term U.S. investment grade bonds while mitigating interest rate risk by holding CLY (iShares 10+ Year Credit Bond ETF) and short positions in interest rate swaps,” according to iShares . Nearly two-thirds of CLYH’s bond holdings have maturities of 20 years or more with another 16% having maturities of 15 to 20 years. Forty-six of the new ETF’s holdings are rated BBB with another 33% rated A and 10.4% carrying AA ratings. The iShares Interest Rate Hedged Emerging Markets Bond ETF holds the iShares J.P. Morgan USD Emerging Markets Bond ETF (NYSEArca: EMB ) , the largest emerging markets bond ETFs, short positions in interest rate swaps. EMB is a popular yield play with a 30-day SEC yield of 5.04%, according to iShares data , but an effective duration of 7.24 years makes the ETF vulnerable to hawkish changes in Fed policy. EMBH helps alleviate that concern with an effective duration of just 0.22 years. “iShares interest rate hedged ETFs are the industry’s first actively managed interest rate hedged products that can potentially benefit from the established liquidity of existing bond funds. By holding shares of EMB and CLY in combination with interest rate swaps, EMBH and CLYH provide easy access to cost effective potential solutions for investors who are attempting to mitigate interest rate risk,” according to iShares. iShares introduced its first rate hedged ETFs in May 2014, the iShares Interest Rate Hedged Corporate Bond ETF (NYSEArca: LQDH ) and the iShares Interest Rate Hedged High Yield Bond ETF (NYSEArca: HYGH ) . Tom Lydon’s clients own shares of EMB. Disclosure: I/we have no positions in any stocks mentioned, and no plans to initiate any positions within the next 72 hours. (More…) I wrote this article myself, and it expresses my own opinions. I am not receiving compensation for it. I have no business relationship with any company whose stock is mentioned in this article.