Tag Archives: management

Best And Worst Q3’15: Large Cap Blend ETFs, Mutual Funds And Key Holdings
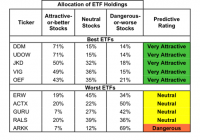
Summary Large Cap Blend style ranks second in Q3’15. Based on an aggregation of ratings of 56 ETFs and 848 mutual funds. DDM is our top-rated Large Cap Blend ETF and CMIIX is our top-rated Large Cap Blend mutual fund. The Large Cap Blend style ranks second out of the 12 fund styles as detailed in our Q3’15 Style Ratings for ETFs and Mutual Funds report. It gets our Attractive rating, which is based on an aggregation of ratings of 56 ETFs and 848 mutual funds in the Large Cap Blend style. See a recap of our Q2’15 Style Ratings here. Figures 1 and 2 show the five best and worst-rated ETFs and mutual funds in the style. Not all Large Cap Blend style ETFs and mutual funds are created the same. The number of holdings varies widely (from 18 to 1334). This variation creates drastically different investment implications and, therefore, ratings. Investors seeking exposure to the Large Cap Blend style should buy one of the Attractive-or-better rated ETFs or mutual funds from Figures 1 and 2. Figure 1: ETFs with the Best & Worst Ratings – Top 5 (click to enlarge) * Best ETFs exclude ETFs with TNAs less than $100 million for inadequate liquidity. Sources: New Constructs, LLC and company filings The Arrow QVM Equity Factor ETF (NYSEARCA: QVM ) is excluded from Figure 1 because its total net assets are below $100 million and do not meet our liquidity minimums. Figure 2: Mutual Funds with the Best & Worst Ratings – Top 5 (click to enlarge) * Best mutual funds exclude funds with TNAs less than $100 million for inadequate liquidity. Sources: New Constructs, LLC and company filings The ProShares Ultra Dow 30 ETF (NYSEARCA: DDM ) is the top-rated Large Cap Blend ETF and the Calvert Large Cap Core Portfolio (MUTF: CMIIX ) is the top-rated Large Cap Blend mutual fund. Both earn our Very Attractive rating. The Ark Innovation ETF (NYSEARCA: ARKK ) is the worst-rated Large Cap Blend ETF and the Virtus Equity Trend Fund (MUTF: VAPAX ) is the worst-rated Large Cap Blend mutual fund. ARKK earns our Dangerous rating and VAPAX earns our Very Dangerous rating. Qualcomm (NASDAQ: QCOM ), is one of our favorite stocks held by Large Cap Blend funds and earns our Very Attractive rating. Since 2010, Qualcomm has grown after-tax profit ( NOPAT ) by an impressive 29% compounded annually. Over this same time frame, Qualcomm’s already top quintile return on invested capital ( ROIC ) has improved from 31% to 54%. In addition, Qualcomm’s NOPAT margin has increased from 23% to 26%. Qualcomm is becoming more efficient and profitable but the stock does not reflect these advancements. At its current price of $62/share, Qualcomm has a price to economic book value ( PEBV ) ratio of 0.8. This ratio implies that the market expects Qualcomm’s NOPAT to permanently decline by 20% from current levels. If Qualcomm can grow NOPAT by just 4% compounded annually over the next five years , the stock is worth $87/share ­- a 40% upside. Amazon.com (NASDAQ: AMZN ) is one of our least favorite stocks held by Large Cap Blend funds and earns our Dangerous rating. Since peaking in 2010, Amazon’s NOPAT has declined by 28% compounded annually. Its ROIC has fallen from 31% to a bottom quintile 2% over the same time frame. We’ve previously written on Amazon’s free cash flow issues , which have only worsened as Amazon had -$7 billion in free cash flow in 2014. Despite the issues, bulls continue to propel AMZN higher, and it is up 47% year to date, which leaves it significantly overvalued. To justify its current price of $535, Amazon must grow NOPAT by 28% compounded annually over the next 23 years . This scenario also assumes Amazon is able to maintain its pre-tax (NOPBT) margin at 1%, a level it has not been able to maintain in recent years. We think the expectations embedded in AMZN are out of touch with reality. Figures 3 and 4 show the rating landscape of all Large Cap Blend ETFs and mutual funds. Figure 3: Separating the Best ETFs From the Worst Funds (click to enlarge) Sources: New Constructs, LLC and company filings Figure 4: Separating the Best Mutual Funds From the Worst Funds (click to enlarge) Sources: New Constructs, LLC and company filings D isclosure: David Trainer and Kyle Guske II receive no compensation to write about any specific stock, style, style or theme. Disclosure: I/we have no positions in any stocks mentioned, and no plans to initiate any positions within the next 72 hours. (More…) I wrote this article myself, and it expresses my own opinions. I am not receiving compensation for it. I have no business relationship with any company whose stock is mentioned in this article.

Forget China, Buy These Domestic-Focused ETFs Instead

China has been at the height of volatility throughout this year. While the economy has been reeling under pressure for long given the protracted slowdown in the domestic manufacturing sector, credit crunch and a property market slowdown, its stock market has been riding wild on overvaluation concerns. If this was not enough, the nation shook the global investing arena in mid-August by devaluating its currency by 2% so that it can support its waning exports. As per barrons.com , the Chinese government viewed yuan as an extremely strong currency. Given the looming Fed policy normalization and its depreciating impact on a basket of currencies, any shift in yuan ‘from market expectations’ seems unreasonable. However, such an epic move in the Chinese currency market hit almost every asset class. Though the Chinese government finally gave the currency a lift to soothe the jittery investors, the panic-stricken sentiment is yet to cool down. So, it’s better to look away from China and concentrate on the domestic economy as the U.S. made plenty of sound economic releases lately. Below we highlight three ETFs to benefit from a decently expanding U.S. SPDR S&P Retail (NYSEARCA: XRT ) U.S. retail sales gained ground in July having grown 0.6% on increased purchase of an array of products and services. The data marked considerable improvement from the June reading of flat sales (and in fact 0.3% decline gauged preliminarily). This gives cues of a solidifying U.S. economy since the start of the third quarter as both job gains and consumer spending remain impressive. The trend can be very well played by a host of retail ETFs. Investors can take a look at the largest retail ETF XRT. This fund consists of 104 stocks, the top holdings being Netflix (NASDAQ: NFLX ), Amazon (NASDAQ: AMZN ) and Advance Auto Parts (NYSE: AAP ). The fund’s gross expense ratio is 0.35%. The $1.11 billion-fund has a Zacks ETF Rank #1 (Strong Buy) with a Medium risk outlook. It was up 0.8% in the last five days and 1.6% in the year-to-date frame (as of August 14, 2015) RBA American Industrial Renaissance ETF (NASDAQ: AIRR ) After retail numbers, the U.S. economy gave a sweet surprise to investors by posting a solid industrial output data for July. Industrial production grew at its best clip in eight months in July as auto production jumped. Motor vehicle production skyrocketed 10.6% last month representing the steepest jump since September 2009. Barring autos, manufacturing ticked up 0.1% in July. Overall, July manufacturing growth of 0.6% breezed past the June reading of 0.1% and economists’ expectations (gauged by Reuters ) of 0.3%. In any case, the U.S. Industrial sector is due for a trend reversal in the coming days mainly to reflect the reduced wage differential between developed and emerging economies. Rising wages in emerging countries and sluggish rise in hourly wages in developed nations have gradually been filling the gap. This should benefit the industrial ETF AIRR. The 42 stock-fund is equal-weighted in nature. Comfort Systems USA (NYSE: FIX ), US Ecology (NASDAQ: ECOL ) and Douglas Dynamics (NYSE: PLOW ) are top three holdings of the fund each with over 3% weight. This $56.3 million-ETF charges 70 bps in fees. The fund has lost about 7% so far this year and but was up 1.4% in the last five trading sessions. iShares Russell 2000 Value ETF (NYSEARCA: IWN ) Apart from strong retail and manufacturing data, the producer price index, job and housing data were all upbeat. This makes the case for a domestically-focused equity play stronger. Investors should note that small-cap stocks better reflect the U.S. economic growth as these are less exposed to foreign economies. Moreover, a stronger greenback presently makes large-cap U.S. stocks a little vulnerable; while small-caps are best-suited for this type of scenario. Investors can benefit from this scenario by investing in small-cap value ETF IWN. Notably, a sudden lift in value quotient in the market thanks to the rout caused by the Chinese currency episode makes a value ETF a better choice than the growth one. The 1,316 stocks-fund has about $5.80 billion in AUM. No stock takes more than 0.5% weight in the fund, suggesting low concentration risk. Sector wise, this ETF is heavy on financials (42.7%) followed by industrials (12.2%) and consumer discretionary (10.8%). The fund charges 25 bps in fees and has a Zacks ETF Rank #3 (Hold). In the last five trading sessions (as of August 14, 2015), the fund added about 1%; while it is down over 3% so far this year. Original Post

5 Large-Cap Blend Funds For Growth And Value Investing

Blend funds are a type of equity mutual fund which holds in its portfolio a mix of value and growth stocks. Blend funds are also known as “hybrid funds”. Blend funds aim for value appreciation by capital gains. It owes its origin to a graphical representation of a fund’s equity style box. In addition to diversification, blend funds are great picks for investors looking for a mix of growth and value investment. Meanwhile, large-cap funds usually provide a safer option for risk-averse investors, when compared to small-cap and mid-cap funds. These funds have exposure to large-cap stocks, providing long-term performance history and assuring more stability than what mid-cap or small-caps offer. Below we will share with you 5 buy-ranked large-cap blend mutual funds. Each has earned a Zacks Mutual Fund Rank #2 (Buy) as we expect these mutual funds to outperform their peers in the future. Deutsche Core Equity S (MUTF: SCDGX ) seeks capital appreciation along with current income and income growth. A lion’s share of its assets is invested in equities or mostly in common stocks. SCDGX invests mostly in large US firms, but is not restricted by market capitalization limitations. The Deutsche Core Equity S fund has returned 13.6% over the past one year. SCDGX has an expense ratio of 0.59% as compared to category average of 1.04%. PNC Large Cap Core C (MUTF: PLECX ) invests in broad range of US equities of large-cap firms, including American Depositary Receipts, preferred stocks, warrants and rights. A lion’s share of PLECX’s assets is invested in firms with at least $3 billion worth of market cap. The PNC Large Cap Core C fund has returned 12.5% over the past one year. Douglas J. Roman is the fund manager and has managed PLECX since 2009. Northern Large Cap Equity (MUTF: NOGEX ) seeks to provide long-term capital appreciation. NOGEX invests a majority of its assets in large-cap firms. These companies will have a market capital, at the time of purchase, within the range of those listed in the S&P 500 Index. Northern Large Cap Equity fund has returned 10.3% over the past one year. As of June 2015, NOGEX held 57 issues, with 5.21% of its total assets invested in Apple Inc (NASDAQ: AAPL ). JPMorgan US Equity R5 (MUTF: JUSRX ) aims to provide high total return. JUSRX invests a lion’s share of its assets in domestic companies. JUSRX mostly invests in common stocks of mid-to-large-cap domestic firms. It may also invest a maximum of 20% of its assets in foreign companies. JPMorgan US Equity R5 fund has returned 10.2% over the past one year. JUSRX has an expense ratio of 0.59% as compared to category average of 1.04% Vanguard Growth & Income Investor (MUTF: VQNPX ) invests in a diversified group of stocks chosen with the help of sophisticated computer models. VQNPX seeks stocks that appear to be undervalued by the market and that, as a group, appear likely to provide higher returns than the unmanaged Standard & Poor’s 500 Composite Stock Price Index while having similar risk characteristics. Vanguard Growth & Income Investor has returned 9.9% over the past one year. Philip W. Kearns is the fund manager and has managed VQNPX since 2014. Original Post