Tag Archives: linkedin

Tech ETFs That Braved The Storm In February

Among other reasons, the month of February 20 16 will be remembered for the broad-based sell-off in the tech space. In any case, a retreat from high-growth stocks kept this space off the radar, but the tension flared up when LinkedIn Corp. (NYSE: LNKD ) issued a lackluster guidance for the first quarter of 20 16 in early February (read: LinkedIn Crashes: Should You Connect with Social Media ETF? ). Along with LinkedIn, the famous FANGs (Facebook (NASDAQ: FB ), Amazon (NASDAQ: AMZN ), Netflix (NASDAQ: NFLX ) and Google (NASDAQ: GOOG ) (NASDAQ: GOOGL ) (i.e. Alphabet) were also hit hard. Notably, the famous four contributed a lot to last year’s tech surge. However, the bloodbath in these stocks dragged down the tech-laden Nasdaq exchange, forcing it to be the worst performing index among the top three U.S. indices. Nasdaq- 100 ETF (NASDAQ: QQQ ) was off over 1.8% in February while Technology Select Sector SPDR ETF (NYSEARCA: XLK ) lost about 1%. Apart from the LinkedIn-induced crash, overvaluation concerns, global growth issues and corporate recession were responsible for last month’s technology tantrum. Almost all ETFs catering to cyber security, the broader Internet, cloud computing and software were the hardest hit in the technology meltdown. Still, there are a few tech ETFs which dared the sell-off to end the month in the green. Below we highlight three such tech ETFs. iShares North American Tech-Multimedia Networking ETF (NYSEARCA: IGN ) – Up 6.8% This ETF provides a concentrated exposure to the domestic multimedia networking securities by tracking the S&P North American Technology-Multimedia Networking Index. Holding 26 securities in its basket, Motorola (NYSE: MSI ) takes the top spot with a 9.5% allocation. This is followed by Qualcomm (NASDAQ: QCOM ) (9.35%) and Cisco Systems (NASDAQ: CSCO ) (8.7%). The product has a definite tilt toward small cap securities that account for 43%, followed by mid caps at 34%. It has accumulated $78.9 million in its asset base while sees a moderate volume of around 7 1,000 shares a day. Expense ratio comes in at 0.48%. The fund has a Zacks ETF Rank of 1 or ‘Strong Buy’ rating with a high risk outlook. PowerShares S&P SmallCap Info Tech ETF (NASDAQ: PSCT ) – Up 3.8% This fund tracks the S&P SmallCap 600 Capped Information Technology Index. It has amassed $377.5 million in its asset base and trades in average daily volume of about 4 1,000 shares. The ETF charges 29 bps in fees per year from investors. Holding 102 securities in its basket, the product is well spread across securities with none holding more than 3.5 1% share (read: 5 Small Cap ETFs & Stocks that Beat Russell 2000 in 20 15 ). From an industry look, about one-fourth of the portfolio is allocated toward electronic equipment, followed by semiconductors ( 19.43%) and software ( 16.29%). The product has a Zacks ETF Rank of 2 or a ‘Buy’ rating with a high risk outlook (read: Top Tech ETFs of 20 15: The Best from a Winner ). First Trust NASDAQ Technology Dividend Index Fund (NASDAQ: TDIV ) – Up 3. 1% This fund provides exposure to the dividend payers in the technology sector by tracking the Nasdaq Technology Dividend Index. The product has amassed about $462.9 million in its asset base and trades in moderate volume of about 98,000 shares per day. The ETF charges 50 bps in annual fees and holds about 96 securities in its basket (read: ETFs to Tap on Cisco’s Upbeat Q4 Results ). Cisco occupies the top position in the fund, making up for roughly 8.23% of the assets followed by IBM (NYSE: IBM ) (8.04%) and Microsoft (NASDAQ: MSFT ) (8.0 1%). In terms of industrial exposure, the fund allocates nearly one-fifth portion in semiconductor and semiconductor equipment, followed by diversified telecom services ( 17%), software ( 15.52%), technology hardware, storage & peripherals ( 15.3%), and communications equipment ( 14.6%). Original Post
Bears Miss Out On Social Media Payday

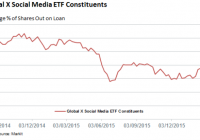
Social media shares have borne the brunt of the recent market selloff but few short sellers are lining up to short the market despite its recent underperformance as tracked by the Global X Social Media ETF (NASDAQ: SOCL ). Social media companies make up half of the once hotly tipped but now largely discredited , “FANG” trade of fast growing tech companies with a global presence. The market’s recent shunning of these high flying mercurial shares, spurred on by a spate of disappointing tech earnings and wider fears surrounding the health of the global economy means that every one of the acronym’s four constituents are trading over 10% off their recent highs. The headwinds faced by the sector’s flagship stocks are reflected in the overall sector as the Global X Social Media ETF hit a two and a half year low earlier this month. While the fund has rebounded somewhat in the last 10 days, it is still down by 13% ytd which is more than twice the fall seen by the rest of the market. The headwinds felt by the sector have been relatively universal as eighty percent of the ETF’s constituents have seen their shares retreat year to date. Collapse catches short sellers out This recent collapse of the once popular trade looks to have caught short sellers out as the ETF’s constituents entered 2016 with a below average short interest. In fact, demand to borrow the fund’s constituents fell by over a third last year and short interest stood near a two year low prior to the selloff. This indifference towards social media shares runs against that seen in the rest of the market where short selling stands at multi year highs. While there has been a 7% increase in demand to borrow social media shares since the start of the year, that number also trails the increase in shorting activity seen in the S&P 500 where average short interest is up by double digits since the start of the year. Lack of appetite universal As with the fall in share prices, the lack of appetite to sell social media shares short is fairly universal as only seven of SOCL’s constituents see any material short interest as defined by having more than 3% of shares out on loan. Pandora (NYSE: P ) is the most shorted of the lot with 8% of its shares now out on loan. Its shares have fallen by a quarter as investors’ fret about the company’s prospects in an increasingly crowded streaming field. Ironically, Groupon (NASDAQ: GRPN ), which was the highest conviction short at the start of the year, has become a painful short as its shares surged following Alibaba’s (NYSE: BABA ) disclosed stake in the online discounter. Short sellers have covered 10% of their positions as their trades went against them. The only firm to see a material rise in short interest across the field since the start of the year has been LinkedIn (NYSE: LNKD ) after its shares nearly halved in the wake of a disappointing earnings update. While short interest in the professional social media firm has since quadrupled, the 2.1% of LNKD shares now out on loan is still less than that seen at the start of 2015. Investors not buying dip Investors in SOCL have shown little patience to ride out the recent volatility as over $32m of funds have flowed out of the ETF since the start of the year. These strong outflows represent over a quarter of the AUM managed by the fund at the start of the year which underscores the wave of negative sentiment felt by the sector since the start of the year.

How Many Stocks Should You Own? Remember Warren Buffett’s Advice

Summary Diversification is trumpeted as a key point of proper portfolio design. Warren Buffett disagrees with diversification, with a single caveat. The return spread among stocks suggest that every new holding you add is more likely to be a loser than a winner. If you asked SeekingAlpha readers why investors should own more than one stock, the overwhelming response would easily be diversification. The idea is simple: the more holdings you have, the less exposure you have to unsystematic risk (risk associated with a particular company or industry). Now, if you asked a follow-up question, “How many stock holdings you should have?”, you would end up with a hotly debated topic. On page 129 of my copy of The Intelligent Investor , legendary money manager Benjamin Graham advocates holding 10 to 30 positions. Modern portfolio theory supported this advice, and many continue to follow its preachings religiously. According to this theory, if you own 20 well-diversified companies, each held in equal amounts, you’ve eliminated 70% of risk (as measured by standard deviation) and reduced volatility. Can’t argue with the math (or can you?), and diversification has been harped on by many as the foundation of any properly constructed portfolio. It is likely that anyone that has had a financial advisor or even discussed finances with a family friend has heard this advice before. Always spread your capital across multiple sectors and markets is in that person’s best interest. Makes sense right? Who doesn’t want less volatility and risk? Warren Buffett apparently. “Diversification is protection against ignorance. It makes very little sense for those who know what they’re doing.” – The Oracle of Omaha Himself So, Do You Know What You’re Doing? Of course, modern portfolio theory and its offshoots were theorized between the ’50s and ’70s. Volatility is up since then, and stocks have become increasingly uncorrelated with the underlying market. To more clearly illustrate this point, stocks increasingly don’t follow a normal distribution pattern: * Source: Investopedia The results of the above image have been repeated over and over in recent market studies. The key takeaway for an individual investor is that the odds of a stock you own outperforming the stock market is actually worse than 50/50 , contrary to what many investors might think off hand. The reason for this is because overall market returns have been boosted by just a handful of “superstar” stocks, like Apple (NASDAQ: AAPL ) or Microsoft (NASDAQ: MSFT ). If you don’t own something like the next Apple or Microsoft in your portfolio (roughly 1 in 16 odds), then well, you’re likely doomed to underperform. So if you have a portfolio of 16 stocks, what are the odds you have that one in sixteen superstar company included based on random chance? Just 38%. Let us say you get lucky and manage to stumble upon a superstar. Now the question is whether you will continue to hold it as it multiplies. Enter the disposition effect . Retail investors have a tendency to sell winners (realizing gains too early) and hold onto losers, following the thought process that today’s losers are tomorrow’s winners. How many investors held on to Apple from $7.00/share in the early 2000’s all the way up to more than $700.00/share (split-adjusted) today? The answer is likely very few. Retail investors took the profit from the double or triple (if they even held that long) and likely didn’t reinvest back in because they had sold in the past. None of this changes the fact that the more companies you own, the more you will inevitably track the index of the positions you hold. In order to generate alpha (abnormal return adjusted for risk), it is a fact that the more stocks you own, the less likely you will be able to generate that alpha. The more holdings you have, the more likely you will have just tracked the index that your holdings are a part of, but in an inefficient way. For all your trouble, you are out both your free time and likely higher trading costs. The question then is why bother with all the headaches of investing in numerous individual companies you buy individually, if you could simply just buy the index and take it easy? If you take a look at major hedge fund and money manager holdings, it is clear that concentrated holdings are used to drive alpha. Visiting the Oracle of Omaha’s portfolio, the man clearly practices what he says. The top five holdings of Berkshire Hathaway (NYSE: BRK.A ) (NYSE: BRK.B )[Wells Fargo (NYSE: WFC ), Kraft Heinz (NASDAQ: KHC ), Coca Cola (NYSE: KO ), IBM (NYSE: IBM ), and American Express (NYSE: AXP )] constituted 67% of his portfolio as of September 30, 2015. 43 scattered holdings constituted the remaining 33%. As for diversifying across sectors versus buying what you know and understand, 37% of Buffett’s holdings fall in the Consumer Staples sector and 35% in Financials. The man clearly doesn’t buy utilities just because portfolio theory tells him he should in order to reduce his risk. Conclusion Thousands of people will read this article. Are you smarter than two thirds of them? If you don’t believe that, buy ETFs, sit back, and be content with market returns. If you think you’re smarter than two thirds of readers of this article (I suspect 95% of you believe that), then the takeaway is slightly different. Diversification, for the sake of diversification, is stupid. Buy what you know, can understand, and believe in the long-term potential of. Don’t understand bank stocks? Reading their SEC filings even gives me headaches, and I work at one. If you don’t understand the company, chances are you aren’t going to pick a winner other than by dumb luck. You shouldn’t lose sleep at night for not having exposure to an industry you can’t adequately review, and it is likely your portfolio returns will thank you for it. As far as how many positions to have, hold as few positions as you are comfortable with when it comes to risk and volatility in order to increase alpha on your high conviction positions. For most investors, that sweet spot still likely falls within modern portfolio theory guidance, around 15 to 25.