Tag Archives: investment
Atmos Energy’s (ATO) CEO Kim Cocklin on Q3 2015 Results – Earnings Call Transcript
Atmos Energy Corporation (NYSE: ATO ) Q3 2015 Results Earnings Conference August 06, 2015, 10:00 PM ET Executives Susan Giles – VP of IR Kim Cocklin – CEO, President and Director Bret Eckert – CFO and SVP Analysts Brian Russo – Ladenburg Thalmann & Company Charles Fishman – Morningstar Research Spencer Joyce – Hilliard Lyons Operator Greetings, and welcome to the Atmos Energy Fiscal 2015 Third Quarter Earnings Conference Call. At this time, all participants are in a listen-only mode. A brief question-and-answer session will follow the formal presentation. [Operator Instructions] As a reminder, this conference is being recorded. It is now my pleasure to introduce your host, Susan Giles , Vice President of Investor Relations for Atmos Energy. Thank you Ms. Giles. You may begin. Susan Giles Good morning, everyone. Thank you for joining us. Our speakers this morning are Kim Cocklin, President and CEO; and Bret Eckert, Senior Vice President and CFO. There are other members of our leadership team here to assist with questions as needed. Our earnings release, conference call slide presentation and our Form 10-Q we filed last night are available on our website at atmosenergy.com. We will refer to just a few of the slides during this live call, but we’ll take questions on any of them at the end of our prepared remarks. As we review these financial results and discuss future expectations, please keep in mind that some of our discussion might contain forward-looking statements within the meaning of the Securities Act and the Securities Exchange Act. Please see Slide 21 for more information regarding the risks and uncertainties we consider in making these forward-looking statements and where to go to get more information on these risks and uncertainties. Now I would like to turn the call over to our President and CEO Mr. Kim Cocklin. Kim. Kim Cocklin Thank you very much, Susan, and good morning everyone. We certainly appreciate you joining us this morning and your continued interest in our company Atmos Energy. Yesterday as you are aware we reported consiolidated net income of about $56 million or $0.55 per diluted share. For the first nine months of fiscal 2015 the reported consolidated debt income was about $292 million or $2.86 per diluted share. Company’s performance during the quarter offers yet another confirmation at our long-term strategy to grow by investing in the safety and reliability of our regulated infrastructure continues to generate consistent operational and financial results. As a result we are pleased to increase our fiscal 2015 earnings guidance to a range between $3.10 from the previously announced ranges between $2.90 and $3.05 per diluted share. Bret will provide a little bit more color around that in his remarks. The execution of our strategy has also allowed us to strengthen our financial position and this was recognized was Fitch when they upgraded our long-term debt rating to A from A minus on July 1. Our debt capital ratio of June 30 was 45.5 % and all liquidity remained strong with over $1 billion of capacity available from our credit facilities. Yesterday our board declared our 127 consecutive quarterly cash dividend. The indicated annual dividend rate for fiscal 2015 is a $1.56 per share. I’m going to turn the call over to our CFO Bret Eckert for more detailed discussion of the results. Bret. Bret Eckert Thanks Kim, and good morning to everyone. Slides 2 and 3 detail reported net income an income excluding net unrealized margins to the three and nine month periods of fiscal year 2015 and 2014. Earnings excluding unrealized margins for the current three month were $55 million or $0.54 per diluted share versus $46 million $0.45 per diluted share in prior year quarter. Earnings excluding unrealized margins for the current nine months were $287 million or $2.81 per diluted share compared with $259 million or $2.69 per diluted share of last year. Remember last year’s nine months results included the favorable impact was significantly colder than normal weather. Slides 4and 5, provides financial highlights for our regulated operations. In the quarter rate increases lifted distribution gross profit by $16 million and about $62 million for the current nine-months. At APT approved GRIP filings in fiscal 2014 and 2015 listed margins by over $9 million in the quarter and $37 million for the nine-months. However, period-over-period results in our distribution segment were negatively impacted that by weather that was 31% warmer than the prior year quarter and 9% warmer than the prior year nine-months. This reduced gross profit by about $1 million for the quarter and $9 million for the nine-month period. On non regulated segment is detailed on Slide 15 and 16, delivered gas increased in both the quarter and year-to-date period driven by stronger per unit margin offset by a slight decrease in delivered gas volumes. Other margins decreased about $3 million in the quarter and $17 million in the current nine-month as less volatile market conditions created few opportunities to capture incremental gross profit compared to the same periods one year ago. Shifting now to the income statement O&M increase by about $7 million in the quarter and about $18 million for the current nine-months. As we expected both period of experience higher levels of pipeline maintenance writeaway expenses despite a very wet spring that impacted the amount of maintenance that could to be performed. We do anticipate the maintenance expenses to continue and accelerate fourth quarter as the whether rise out. In addition, the current quarter saw increased employee related costs associated with the timing of the recognition of higher variable incentive compensation expense as a result of increased operating results these increases will partially offset by lower legal expense. Interest charges decreased by $4 in the quarter and about $10 million for the nine-months primarily due to replacing the $500 million of 10 year debt with $500 million of debt at a lower rate back in October 2014. Details of capital spending represented on Slide 6, over 80% of our capital expenditures were associated with safety and reliability spending, as we activated CapEx increased by about $115 million current nine month period compared to one year ago. Moving now earnings guidance for fiscal 2015 and you may want to turn to Slide 18 where we’ve detailed revised contributions from our regulated and our non-regulated operations as well as selected expenses for the year. As Kim mentioned, we have tightened and slightly increased the earnings guidance range for fiscal 2015 with earnings per diluted share now expected to range from $3 to $3.10 excluding unrealized margin. We now project regulated operations generate net income in the range of $290 million and $305 million and non-regulated operations to generate net income in the range of $14 million to $18 million. The updated guidance primarily reflects stronger than anticipated consumption in our distributions segment. This increased consumption levels not only reflect the impact of colder than normal experienced during the winter heating season, but also higher than anticipated residential and commercial consumption level following the winter heating season. We also expect higher realized non-regulated gross profit as a result of the improved delivered gas performance. Consolidated O&M expense is now expected to range from $525 million to $535 million driven by increased regulated pipeline maintenance activities and higher employee related variable incentive compensation expense. Turning to Slide 28, we now anticipate the annual operating income impact for rate outcome implemented in fiscal 2015 to range from $85 million to $95 million. This is slightly different than our original projection largely due to increased customer consumption experienced in the prior fiscal year. As a result, test period revenues were higher which reduced the size of requested rate increases. Thank you for your time and now I’ll hand the call back over to Kim. Kim Cocklin Thank you very much for that report, Bret. Our performance again confirms that what we’re doing is working. We are experiencing very good results all around both operationally and financially as we strive to become the nation’s safest gas utility. We’ve fostered good relationship with our regulators who are tasked with balancing the needs to consumers and businesses like Atmos Energy and we’ve also built and established partnership with them as well as our customers, employees, in the cities we serve. Our regulated operations as Bret said continue to provide stable and predictable earnings for the enterprise. As of August 5, rate outcomes and incremental differals that provided annual operating increases of about $87 million thus far in fiscal 2015. Rate actions that are filed and pending total about another $9 million of requested annual operating increases. We expect to file another three to four cases this fiscal year that combined that would request anywhere from $15 million to $20 million of additional increases to operating income. As you are well aware safety is our number one priority and it does require significant investment both capital and expense. As gas prices remain low for the foreseeable future, the price dynamic continues to facilitate the investment we’re committed to making. This year we’ll spend from $900 million to $1 billion of capital to fortify our system. You’ve heard this bfore, we may sound like a broken record or you might think you are watching the movie Ground Hog Day, but we have been and will continue to delivery on our promises and commitment. Investing in the safety and reliability of our system is the highest and best use of our capital. These capital investments should grow rate base by 9% to 10% and earnings per share by 6% to 8% on an annual basis and provide a projected total return to shareholders of between 9% and 11%. In November, we’ll look forward to meeting with you and communicating our refreshed five year plan, which will provide projections through fiscal 2020. We certainly appreciate your time this morning and now we’ll take any questions that you have, Kevin. Question-and-Answer Session Operator Thank you. [Operator Instructions] Our first question comes from the line of Brian Russo with Ladenburg Thalmann. Please proceed with your question. Brian Russo Hi, good morning. Bret Eckert Good morning, Brian. Brian Russo Just in terms of the increased guidance, if you kind of back into the EPS for the reg or non-reg, it looks like it’s split fairly evenly $0.05 of EPS increase on reg another $0.05 on regulated side. Is that just sustainable or is it related to weather and it’s not – and it shouldn’t really re-occur when meeting is the base earnings power $0.10 higher now than it was previously? Bret Eckert Well as we had said last call Brian it’s few questions, we expect weather to weather consumption to contribute about $0.04 to $0.06 to earnings in fiscal 2015, we talked about the delivery gas business with the slight increase in our guidance that really is driven by the delivery gas business, we see per unit margins strengthened though in end of the year expecting margins in the $0.10 to $0.11 range you see in margins closer to the $0.11 to $0.12 range and that is really what is causing the lift in that business. So we’re only coming out with guidance for fiscal 2016 as we announce our full-year results in November but those are the main drivers of the increase in earnings this year. Brian Russo Now the increase in unit margins on the non-reg side, is that sustainable? Bret Eckert That’s a good question Brian. I mean we didn’t experience that same performance last year from them and this year was then the trend increase for their margins and we’re also seeing increased consumption in on the regulated side of the business. I think that there is some traction that is being gained nationwide by energy consumers that are recognized that natural gas is an extremely good purchase and it continues to lead the way. So we’re seeing that, they are seeing some of that in the industrial sector but and the other thing is that their delivered share gas focus is continuing to emphasize providing additional value to customers that are willing to recognize that value. So they’re being the non-regulated group of being a little bit more focused on the selection of who they’re serving and so they are high-grading their customer base which has translated at least this year into those better margins that we’re seeing. So we’re going to continue to have that strategy of emphasizing service to customers that are recognizing the additional value they bring to the table in terms of just all of the energy services that are available and then providing the premium product in the form of natural gas that they are getting. But so some folks are willing to pay up right now because of the competitive edge that gas brings to their product and their process. Brian Russo Got it okay and then just the it looks like you’ve got about 55% equity ratio, can you talk about maybe the trends you see there, is that kind of a good target trend lower as you raise that financial CapEx? Bret Eckert We continue today, we are committed to kind of growing this spending of $900 billion to $1.1 billion through 2018 in a balanced form. The 55% is the product to the equity issuance we did back in February of 2014. Brian Russo Okay. And then just lastly the upcoming regulated pipeline, GRC filing I think it is December 2016 any – can you just comment what are the major drivers there and I think we should be aware of that this time? Bret Eckert Generally there are no unusual drivers; it is going to be a typical rate case with the focus on cap structure, on return and on service levels and rights. But it won’t be anything unusual. Brian Russo Okay, great. Thank you very much. Bret Eckert Thank you, Brian. Operator Thank you. Our next question comes from the line of Spencer Joyce with Hilliard Lyons. Please proceed with your question. Bret Eckert Spencer? He dropped off, lost Spencer. Operator Our next question comes from the line of Charles Fishman with Morningstar. Please proceed with your question. Charles Fishman Good morning. The variance on O&M which were attributed to the employee incentive plan is that something you just recognize that in the third quarter that is not ongoing, we won’t see that next quarter, is that correct? Bret Eckert You recognize an incentive comp base on your initial targets and then with revision of the guidance upwards with only come in higher, on the quarter once you change that is when we catch up on the higher level of expense and so this time we got recorded in the third quarter. Charles Fishman Okay, got it. And then the second question was Bret you made the comment that you were experiencing higher consumptions following the heating season, I appreciate if you have add some color to that total whatever you can . Bret Eckert Yeah, we have seen, through the nine month period consumption higher than historical norms coming through and so we have always got consumption driven by weather and then you’ll just got a modest consumption consumer will use on a average degree day and we have seen that be higher than historical norms continue into the first nine months of this fiscal year. Charles Fishman Whats going on? Bret Eckert And it’s hard to highlight exactly what’s driving consumer consumption patterns, but we have seen higher consumption this year. Kim Cocklin Charles, I mean that’s kind of national, nationwide circumstance we flipped it some of the tests that are coming out we looked at AGA statistics that recently came out I think last week or two weeks ago and it indicated the better reversal of the trend for declining use of natural gas and for the last two years running there has been an increase in the consumption trend by residential customers. Again, I think, the traction associated with our industry getting out a little bit and promoting the competitiveness in the abundance and the environmental qualities of natural gas. Charles Fishman Okay. Bret Eckert Certainly in the competitive against other alternative fuel sources. Charles Fishman Okay, thank you for that. Kim Cocklin The industry and I think you know we are just experiencing because we were, one of the biggest R&D utilities on the planet. Charles Fishman Okay, thanks a lot. Operator Thank you. [Operator Instructions]. Our next question comes from the line of Spencer Joyce with Hilliard Lyons. Please proceed with your question. Spencer Joyce Let’s try out this again user error on my part. I apologize. Kim Cocklin Okay. Bret Eckert Well first mistake of the year for you. Spencer Joyce Yes, I got to say so keeping with the Bill Merry movies it is clear that the Cinderella story continues to execute here, nice quarter. Right, what becomes of the broken it is and another one when that comes to mind on if you are not in the stock by the four tops? What in the world applies with what is the sector doing? Kim Cocklin It is flattish, it is mostly interest rates on say, we are kind of drawn to tough comp of where lot of the stocks ended last year, but optimistic here is we look towards the back half. Spencer Joyce Yes. I guess to be long-term. In any case just want to kind of have question from me, we are inching kind of ever closer here to the endpoint of kind of standing 2018 guidance if you will, but I know we are still a couple of years out but can you talk about any clarity that maybe developing as we look maybe towards the tips of the decade here and potentially when we can see you all maybe roll that target out another year or two? Bret Eckert Great question, Spencer we do plan in November when we released earnings of fiscal 2015 to come out and extend that plan to four, five years through 2020, we have launched the plan updated the plan last in 2014 to 2018 we didn’t want to getting practice of rolling out another year, every year. So we kind of do it every two years but we will put out revised plan or updated plan if you will through 2020 we will put guidance out there, guidance range out there in 2020 and as we talked before imagine for 2018 we continue to see the ability to invest at these levels enhancing the safety into the liability for systems. So we expect that in our analyst meeting in November. Spencer Joyce Perfect, we will eagerly await that roll out there. Again good quarter and nice year, shaping out to be a good one. That is all I have. Kim Cocklin Thanks Spencer. End of Q&A Operator Thank you. There are no further questions at this time. I would like to turn the floor back over to management for closing comments. Susan Giles Thank you, Debin. I just want to remind you all recording of the call is available through November 4 and I am here if you have any additional questions. Thank you so much for joining us. Bye, bye. Copyright policy: All transcripts on this site are the copyright of Seeking Alpha. However, we view them as an important resource for bloggers and journalists, and are excited to contribute to the democratization of financial information on the Internet. (Until now investors have had to pay thousands of dollars in subscription fees for transcripts.) So our reproduction policy is as follows: You may quote up to 400 words of any transcript on the condition that you attribute the transcript to Seeking Alpha and either link to the original transcript or to www.SeekingAlpha.com. All other use is prohibited. THE INFORMATION CONTAINED HERE IS A TEXTUAL REPRESENTATION OF THE APPLICABLE COMPANY’S CONFERENCE CALL, CONFERENCE PRESENTATION OR OTHER AUDIO PRESENTATION, AND WHILE EFFORTS ARE MADE TO PROVIDE AN ACCURATE TRANSCRIPTION, THERE MAY BE MATERIAL ERRORS, OMISSIONS, OR INACCURACIES IN THE REPORTING OF THE SUBSTANCE OF THE AUDIO PRESENTATIONS. IN NO WAY DOES SEEKING ALPHA ASSUME ANY RESPONSIBILITY FOR ANY INVESTMENT OR OTHER DECISIONS MADE BASED UPON THE INFORMATION PROVIDED ON THIS WEB SITE OR IN ANY TRANSCRIPT. USERS ARE ADVISED TO REVIEW THE APPLICABLE COMPANY’S AUDIO PRESENTATION ITSELF AND THE APPLICABLE COMPANY’S SEC FILINGS BEFORE MAKING ANY INVESTMENT OR OTHER DECISIONS. If you have any additional questions about our online transcripts, please contact us at: transcripts@seekingalpha.com . Thank you!
A Most Competitive Wealth-Builder ETF Investment Today
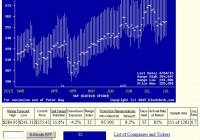
Summary From a population of some 350 actively-traded, substantial, and growing ETFs this is a currently attractive addition to a portfolio whose principal objective is wealth accumulation by active investing. We daily evaluate future near-term price gain prospects for quality, market-seasoned ETFs, based on the expectations of market-makers [MMs], drawing on their insights from client order-flows. The analysis of our subject ETF’s price prospects is reinforced by parallel MM forecasts for each of the ETF’s ten largest holdings. Qualitative appraisals of the forecasts are derived from how well the MMs have foreseen subsequent price behaviors following prior forecasts similar to today’s. Size of prospective gains, odds of winning transactions, worst-case price drawdowns, and marketability measures are all taken into account. Today a most attractive ETF Is the SPDR Biotech ETF (NYSEARCA: XBI ). The investment seeks to provide investment results that, before fees and expenses, correspond generally to the total return performance of an index derived from the biotechnology segment of a U.S. total market composite index. In seeking to track the performance of the S&P Biotechnology Select Industry Index (the “index”), the fund employs a sampling strategy. It generally invests substantially all, but at least 80%, of its total assets in the securities comprising the index. The index represents the biotechnology industry group of the S&P Total Market Index (“S&P TMI”). The fund is non-diversified. The fund currently holds assets of $2.71 billion and has had a YTD price return of +35.66%. Its average daily trading volume of 1,126,650 produces a complete asset turnover calculation in 9.4 days at its current price of $255.09. Behavioral analysis of market-maker hedging actions while providing market liquidity for volume block trades in the ETF by interested major investment funds has produced the recent past (6 month) daily history of implied price range forecasts pictured in Figure 1. Figure 1 (used with permission) The vertical lines of Figure 1 are a visual history of forward-looking expectations of coming prices for the subject ETF. They are NOT a backward-in-time look at actual daily price ranges, but the heavy dot in each range is the ending market quote of the day the forecast was made. What is important in the picture is the balance of upside prospects in comparison to downside concerns. That ratio is expressed in the Range Index [RI], whose number tells what percentage of the whole range lies below the then current price. Today’s Range Index is used to evaluate how well prior forecasts of similar RIs for this ETF have previously worked out. The size of that historic sample is given near the right-hand end of the data line below the picture. The current RI’s size in relation to all available RIs of the past 5 years is indicated in the small blue thumbnail distribution at the bottom of Figure 1. The first items in the data line are current information: The current high and low of the forecast range, and the percent change from the market quote to the top of the range, as a sell target. The Range Index is of the current forecast. Other items of data are all derived from the history of prior forecasts. They stem from applying a T ime- E fficient R isk M anagement D iscipline to hypothetical holdings initiated by the MM forecasts. That discipline requires a next-day closing price cost position be held no longer than 63 market days (3 months) unless first encountered by a market close equal to or above the sell target. The net payoffs are the cumulative average simple percent gains of all such forecast positions, including losses. Days held are average market rather than calendar days held in the sample positions. Drawdown exposure indicates the typical worst-case price experience during those holding periods. Win odds tells what percentage proportion of the sample recovered from the drawdowns to produce a gain. The cred(ibility) ratio compares the sell target prospect with the historic net payoff experiences. Figure 2 provides a longer-time perspective by drawing a once-a week look from the Figure 1 source forecasts, back over two years. Figure 2 (used with permission) What does this ETF hold, causing such price expectations? Figure 3 is a table of securities held by the subject ETF, indicating its concentration in the top ten largest holdings, and their percentage of the ETF’s total value. Figure 3 source: Yahoo Finance XBI apparently takes a low-concentration approach to holdings, with an average of 1½% of its assets in each of its top ten commitments. This provides a wide dispersion of holdings among competitive contestants in an industry where success rewards can be huge, while failures tend to be complete. If the remaining 88% of assets are distributed on a 1% basis over 85 separate additional bets may be made, offering great diversification, as well as dilution of encountered bonanzas. Where ultimate payoffs are less dependent on initial capital commitment size, this may be an advantaged strategy. Figure 4 is a table of data lines similar to that contained in Figure 1, for each of the top ten holdings of XBI. Figure 4 (click to enlarge) In an industry as unpredictably dynamic as this, wide variations in market experience seem to be the rule. Column (5) contains the upside price change forecasts between current market prices and the upper limit of prices regarded by MMs as being worth paying for price change protection. The average of +18.9% of the top ten XBI holdings is well above the population average of all 2500+ equities MM forecasts of +12.6%. It is about triple the upside forecast for the SPDR S&P 500 Trust ETF ( SPY) price change prospects. The other side of the coin is column (6), which shows what actual worst-case price drawdowns have been typical in the 3 months following each time there has been a forecast like those of the present day. Those risk exposures have averaged -10% in the holdings top ten, worse than -8.6% by equities at large, and only -3.3% on the SPY ETF. But these holdings have attractive reward tradeoffs between returns and risks, with the top ten (column 14) at a ratio of 1.8, compared to equities overall at 1.5 times. Still, the market average of SPY provides a best ratio of 2.1 times risk avoidance, at a cost of small reward. Another qualitative consideration is the credibility of the ten XBI big holdings after previous forecasts like today’s. The net average price change (column 13) of the ten has been 0.8 times the size of the upside forecast average, +18.9% compared to +15.6%. The equity population’s actual price gain achievement, net of losses has been a pitiful +3.4% compared to promises of 12.6%. The ability of XBI holdings to recover from those worst-case drawdowns and achieve profits occurred in 70% of experiences. The equity population only recovered less than two thirds of the time, and while the SPY experiences were more resistant than the ten XBI holdings, the achieved gains were much smaller. SPY has had only +3.7% gains previously from like forecasts of +6.8%. Conclusion XBI provides attractive forecast price gains, supported by its equally appealing largest holdings. Both the ETF and many of its major holdings offer very attractive prospects in near-term price behaviors, demonstrated by previous experiences following prior similar forecasts by market makers. The diversity of its holdings is very broad, providing a wide opportunity to share in constantly developing discoveries across the biotechnology field. Disclosure: I/we have no positions in any stocks mentioned, and no plans to initiate any positions within the next 72 hours. (More…) I wrote this article myself, and it expresses my own opinions. I am not receiving compensation for it (other than from Seeking Alpha). I have no business relationship with any company whose stock is mentioned in this article.