Tag Archives: investing ideas

The 4% Spending Rule: Golden Rule Or Guideline?
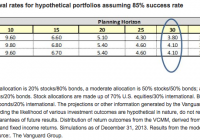
Summary Today’s environment of high equity valuations and low interest rates shouldn’t be ignored. Are investment costs a factor, and if so, how much? Embrace a dynamic spending strategy that considers market performance and allows for flexibility each year. By Maria Bruno, CFP Hardly, a week goes by without seeing some type of headline news discussing the viability of the venerable 4% spending rule. Indeed a simple internet search will yield more than 5 million results! It’s no wonder that retirees may be more confused now than ever. It’s hard to believe that 20 years have passed since William Bengen published his research about sustainable retirement withdrawal rates.[1] During this time, many researchers (including those at Vanguard) have discussed, debated, and continued to crunch the numbers. Much has occurred in the capital markets, including three bull markets, two bear markets, and historically low fixed income yields. Given the milestone anniversary, it’s a good time to reflect, and there’s no better way to start than by defining what the guideline means. Simply put, the 4% spending guideline stated that retirees with a diversified portfolio split between stocks and bonds could safely withdraw 4% of their initial balance at retirement, adjusting the dollar amount for inflation each year thereafter. This level of spending was intended to provide a stable, inflation-adjusted income stream that had a strong likelihood of being sustained for 30 years, based on historical returns for stocks and bonds. Why does the 4% spending rule get a bad rap? First, much of the earlier research was based on modeling of historical asset class returns. While this approach has its merits, the major limitation is that it doesn’t consider current market and economic conditions. In today’s environment of elevated equity valuations and sustained low interest rates, these factors can’t be ignored. To that end, Vanguard’s research incorporates the current market and economic environment in its long-term projections. (See Figure 1.) Second, most well-thought-out research frames the 4% target as a rule of thumb with trade-offs. As with anything in financial planning, guidelines are a starting point and shouldn’t be taken as much more than that. Retirees need to consider their own personal situations when in managing longevity risk-such as their goals, planning horizon, portfolio composition, and comfort level with “stress testing” different market and spending scenarios. Third, the rule of thumb assumes a dollar inflation-adjusted spending program. This means that, at retirement, the retiree spends 4% of his or her portfolio and adjusts that amount annually for inflation. In reality, very few retirees actually stick with such a strict policy. Further, and more important, following an inflation-adjusted spending strategy exposes the retiree to “sequence of returns” risk. With such a model, the spending amount is adjusted annually for inflation but completely ignores portfolio performance. In periods of sustained poor market performance, particularly at the onset of retirement, the retiree is actually spending a greater percentage and, if left unchecked, exposes the portfolio to premature depletion. Indeed, this is one of the major risks of the 4% spending rule. Sure, costs matter, but how much? Many of the published studies show simulated outcomes using benchmark returns as a proxy, with no consideration of real-life costs such as taxes and investment fees. In our studies, we further analyzed hypothetical cost scenarios to stress test portfolio durability using the 4% spending guideline. In the chart above, we highlighted sustainable withdrawal rate durability at an 85% success rate, meaning that in 85% of the simulations the portfolio lasted for at least 30 years. We simulated reductions for cost-0 cost represents the benchmark, 0.25% represents a lower-cost portfolio, and 1.25% represents a higher-cost portfolio (see Figure 2). The results are rather eye-opening. For a moderate investor, the success rates drop from 84% to 74% when higher costs were used. What this means is that the risk of running out of money moved from a 16% to 26%, and the sole factor was investment costs, which is one of the main things that investors can control! No doubt that spending in retirement will continue to be at the forefront of retirees’ minds for the next 20 years. Here’s how I suggest retirees approach the 4% spending rule. First , they should maintain the perspective that this type of analysis should only be used as a modeling tool to help gauge portfolio durability simulations, assuming you maintain a balanced and diversified portfolio. Second , portfolio management costs are a “drag” on their spending, so it’s important to minimize investment costs and follow a tax-efficient portfolio spending approach. Third , they should embrace a dynamic spending strategy that considers market performance and allows for flexibility on an annual basis. Certainly, these three principles are general in nature, but they can provide investors with a nice tailwind as they head into retirement. I’d like to thank my colleagues Michael DiJoseph and Yan Zilbering for their contributions to this research. For more information on dynamic spending, see Vanguard’s research . Footnotes William P. Bengen, 1994. Determining withdrawal rates using historical data. Journal of Financial Planning (October):171-180. Notes IMPORTANT: The projections or other information generated by the Vanguard Capital Markets Model regarding the likelihood of various investment outcomes are hypothetical in nature, do not reflect actual investment results, and are not guarantees of future results. VCMM results will vary with each use and over time. The VCMM projections are based on a statistical analysis of historical data. Future returns may behave differently from the historical patterns captured in the VCMM. More important, the VCMM may be underestimating extreme negative scenarios unobserved in the historical period on which the model estimation is based. All investments are subject to risk. There is no guarantee that any particular asset allocation or mix of funds will meet your investment objectives or provide you with a given level of income. Diversification does not ensure a profit or protect against a loss in a declining market. The Vanguard Capital Markets Model® is a proprietary financial simulation tool developed and maintained by Vanguard’s primary investment research and advice teams. The model forecasts distributions of future returns for a wide array of broad asset classes. Those asset classes include U.S. and international equity markets, several maturities of the U.S. Treasury and corporate fixed income markets, international fixed income markets, U.S. money markets, commodities, and certain alternative investment strategies. The theoretical and empirical foundation for the Vanguard Capital Markets Model is that the returns of various asset classes reflect the compensation investors require for bearing different types of systematic risk (beta). At the core of the model are estimates of the dynamic statistical relationship between risk factors and asset returns, obtained from statistical analysis based on available monthly financial and economic data from as early as 1960. Using a system of estimated equations, the model then applies a Monte Carlo simulation method to project the estimated interrelationships among risk factors and asset classes as well as uncertainty and randomness over time. The model generates a large set of simulated outcomes for each asset class over several time horizons. Forecasts are obtained by computing measures of central tendency in these simulations. Results produced by the tool will vary with each use and over time.

ETFs To Move On Yuan Devaluation

China has been hitting headlines this year for one reason or the other. While the economy has been reeling under pressure for long given the protracted slowdown in the domestic manufacturing sector, credit crunch concerns and a property market slowdown, its stock market has been through a wild ride on overvaluation concerns. Meanwhile, the economy’s exports plunged 8.3% year over year in July, massively falling short of analysts’ expectation of a 1.5% decline as well as the 2.8% drop-off recorded in June. Though a 1.3% fall in exports to the U.S. was not that alarming, exports plummeted 12.3% and 13% in the EU and Japan, respectively. These two regions are presently under QE policy and thus see relatively weak currencies against the greenback. This gave the Chinese policymakers a wake-up call that it is high time to devalue its currency, yuan, to maintain the export competitiveness. As a result, China undervalued its currency yen against the U.S. dollar by a historic amount, i.e., 100 bps on August 11. Yuan has now plunged to the 2012 levels. Per Reuters , China’s central bank fixed the midpoint for its currency at 6.2298 per dollar, down from 6.1162 seen on August 10. The bank also indicated that it was eyeing a currency devaluation of 2%. As per Barrons.com , the Chinese government viewed yuan as an extremely strong currency. Given the looming Fed policy normalization and its depreciating impact on a basket of currencies, any shift in yuan ‘from market expectations’ seems unreasonable. However, such an epic move in the Chinese currency market will definitely leave an impact across the globe. Below we highlight a few asset classes and their ETFs, which may be among the biggest movers. Currency Needless to say, the move will lead the Chinese currency ETF, the WisdomTree Chinese Yuan ETF (NYSEARCA: CYB ), to losses while the dollar ETF, the PowerShares DB USD Bull ETF (NYSEARCA: UUP ), will gain strength. The Aussie dollar lost about 1% following the announcement, putting Australia ETF, the CurrencyShares Australian Dollar Trust ETF (NYSEARCA: FXA ), at risk. Per Reuters, the Australian dollar is often regarded as a liquid proxy for the Chinese currency. China is a major trading partner of Australia and thus the currencies of the duo share a high correlation. Currencies like the Singapore dollar, South Korean won and Taiwan dollar will be stressed as these countries are manufacturing destinations and thus act as competitors to China on the export front. Market experts apprehend a currency war among these Asian tigers in the near future. Gold How much more pain will gold have to bear? The yellow metal already crossed its five-year low level on its way down hit by the dollar strength thanks to the impending Fed rate hike, a deflationary environment prevailing in most part of the developed world and reduced demand from the key consuming nation China because of its waning economy. Now, currency devaluation will likely curb the import demand of gold from China as a feebler currency will turn imports pricier. The SPDR Gold Trust ETF (NYSEARCA: GLD ) tracking the gold bullion will bear the brunt the most, while the impact will not be unnoticed by the gold mining ETF, the Market Vectors Gold Miners ETF (NYSEARCA: GDX ). Apart from gold, several industrial metals will likely see a negative pricing trend in the near term as the Chinese economy accounts for about half of the global consumption of the industrial commodities and is the second-biggest purchaser of oil. The iPath Dow Jones-UBS Nickel Total Return Sub-Index ETN (NYSEARCA: JJN ), the UBS E TRACS CMCI Industrial Metals Total Return ETN (NYSEARCA: UBM ), the ELEMENTS Rogers International Commodity Metal ETN (NYSEARCA: RJZ ) and the United States Copper Index ETF (NYSEARCA: CPER ) are some of the ETFs which might succumb to a slowdown. Equities As we already know that the South Korean and Taiwanese economies thrive on exports, these nations will now be losing on currency competitiveness to China. There are several South Korean companies, namely Samsung Electronics ( OTC:SSNLF ), Hyundai Motor ( OTC:HYMLF ) ( OTC:HYMTF ), LG Corp. and Daewoo, which have big export markets and Taiwan houses one of the largest semiconductor companies in the world – Taiwan Semiconductor. In short, these two countries’ stock markets will be hit by the yuan devaluation in a passive way. This puts the iShares MSCI South Korea Capped ETF (NYSEARCA: EWY ), the Horizons Korea KOSPI 200 ETF (NYSEARCA: HKOR ) as well as the iShares MSCI Taiwan ETF (NYSEARCA: EWT ) and the First Trust Taiwan AlphaDEX ETF (NASDAQ: FTW ) in focus. While this move might help some Chinese sectors and equities, investors should note that most of the Chinese equities ETFs are not hedged to the greenback and thus may see some downward pressure on U.S. exchanges. Some Chinese equities ETFs to watch in the coming days are the Market Vectors ChinaAMC SME-ChiNext ETF (NYSEARCA: CNXT ), the Market Vectors ChinaAMC A-Share ETF (NYSEARCA: PEK ), the iShares China Large-Cap ETF (NYSEARCA: FXI ) and the iShares MSCI China ETF (NYSEARCA: MCHI ). Original Post

ETFs To Lose Or Gain From Solid July Job Data

The U.S. labor market continued its strength with steady job gains in July, which were enough to increase the chances of the Fed pulling its trigger on the first rate hike in almost a decade as early as next month. The Fed in its last FOMC meeting stated that it is on track to increase interest rates albeit at a slower pace if the job market shows further improvement. And this is exactly what happened. The U.S. economy added 215,000 jobs in July driven by higher construction and manufacturing employment that more than offset the collapsing mining sector. Though the number was marginally below the market expectation of 225,000, unemployment remained steady at seven-year low of 5.3%. Additionally, average hourly wages rose five cents to $24.99, bringing the year-over-year increase to 2.1%. Jobless claim were the lowest level since June 2008 at 10.4% against 10.5% in June. Further, the economy appears closer to full employment given that the number of full-time U.S. jobs as a share of total employment reached to 81.7%, marking the highest level since November 2008. The decent job data suggests that the economy continued to gain momentum in July after growing 2.3% in the second quarter. To make the case for rates hike stronger, a surging service sector, increasing business activity, higher consumer spending, a recovering retail and housing market, and rising consumer confidence point to even strong economic growth that would translate into more jobs and the resultant higher rates. ETFs to Watch The news has extended the losing streak for the Dow Jones Industrial Average to the seventh day – the longest since August 2011. Additionally, the index is currently hovering at its six-month low. As a result, a few ETFs were severely impacted by the solid jobs data while a few are expected to gain in the weeks ahead. Below, we have highlighted some that are especially volatile post jobs data and increased chances of rates hike: ETFs to Lose SPDR Gold Trust ETF (NYSEARCA: GLD ) Gold will continue to remain under immense pressure as higher interest rates would diminish gold’s attractiveness since the yellow metal does not pay interest like fixed-income assets and the product tracking this bullion like GLD will lose further. The fund tracks the price of gold bullion measured in U.S. dollars, and kept in London under the custody of HSBC Bank USA. It is the ultra-popular gold ETF with AUM of $23.5 billion and average daily volume of around 5.7 million shares a day. Expense ratio came in at 0.40%. The fund is down 7.9% so far in the year and has a Zacks ETF Rank of 3 or ‘Hold’ rating. iShares MSCI Emerging Markets ETF (NYSEARCA: EEM ) As the Fed moves closer to interest rate hike, emerging markets will slump further. The most popular emerging market ETF – EEM – lost about 7% in the year-to-date timeframe and has seen huge capital outflow which has pulled its total asset base down to $24.2 billion. The fund tracks the MSCI Emerging Markets Index and charges 68 bps in annual fees from investors. Holding 847 securities, the product is widely spread out across various securities but is tilted toward the financial sector at 29.3%, followed by information technology (17%). Among the emerging countries, China takes the top spot at 23.6% while South Korea and Taiwan round off the next two spots with double-digit exposure each. The fund has a Zacks ETF Rank of 3. iShares 20+ Year Treasury Bond ETF (NYSEARCA: TLT ) The U.S. government bonds and ETFs tracking the long end of the yield curve are the most vulnerable to higher interest rates. The ultra-popular long-term Treasury ETF – TLT – tracks the Barclays Capital U.S. 20+ Year Treasury Bond Index and has AUM of $4.9 billion. Expense ratio came in at 0.15%. Holding 29 securities in its basket, the fund focuses on the top credit rating bonds with average maturity of 26.9083 years and effective duration of 17.2035 years. The fund is almost flat from a year-to-date look and has a Zacks ETF Rank of 3. ETFs to Gain PowerShares DB USD Bull ETF (NYSEARCA: UUP ) A rise in interest rates will pull in more capital into the country and lead to further appreciation of the U.S. dollar. UUP is the prime beneficiary of the rising dollar as it offers exposure against a basket of six world currencies – euro, Japanese yen, British pound, Canadian dollar, Swedish krona and Swiss franc. This is done by tracking the Deutsche Bank Long U.S. Dollar Index Futures Index Excess Return plus the interest income from the fund’s holdings of U.S. Treasury securities. In terms of holdings, UUP allocates nearly 58% in euro while 25.5% collectively in Japanese yen and British pound. The fund has so far managed an asset base of $1.3 billion while sees an average daily volume of around 2.6 million shares. It charges 80 bps in total fees and expenses and has added 6.5% in the year-to-date time frame. The fund has a Zacks ETF Rank of 2 or ‘Buy’ rating. Deutsche X-trackers MSCI EAFE Hedged Equity ETF (NYSEARCA: DBEF ) The strength in the greenback is compelling investors to recycle their portfolio into the currency hedged ETFs. For those seeking exposure to the developed market with no currency risk, DBEF could be an intriguing pick. The fund follows the MSCI EAFE U.S. Dollar Hedged Index and holds 913 securities in its basket with none accounting for more than 1.82% share. However, it is skewed toward the financial sector, which makes up for more than one-fourth of the portfolio, while consumer discretionary, industrials, health care, and consumer staples round off the top five with double-digit exposure each. Among countries, Japan takes the top spot at 21%, closely followed by United Kingdom (19%), France (10%) and Switzerland (10%). The ETF has AUM of $14.4 billion and trades in a solid volume of more than 4.7 million shares a day. It charges 35 bps in fees per year from investors and has a Zacks ETF Rank of 3. Link to the original article on Zacks.com