Tag Archives: innovation

6 ETFs With The Largest Exposure To Netflix

Summary 6 ETFs have more than 2% of total assets dedicated to Netflix. Some have exposure as high as 7%. Netflix plunged almost 9% on Thursday, thanks to an earnings report that missed on both revenue and subscriber growth estimates. The size of some of the ETFs listed is very small and thus may face liquidity and tradeability issues. Netflix (NASDAQ: NFLX ) made news this week when it delivered its third-quarter earnings report. The company reported disappointing revenue and subscriber growth, and as a result, the stock dropped over 8% on the day. NFLX has been a very popular momentum stock not just among individual investors, but by ETFs as well. There are 6 ETFs that currently have at least a 2% weighting in Netflix. Some are significantly higher than that, and any ETF that had a large exposure to Netflix on Thursday likely had trouble matching the broader market’s performance. Each of these ETFs is primarily technology and Internet focused, and as a result, is riskier than the average broad equity market fund. Keep in mind that these weightings can change over time, but if you’re looking for exposure to Netflix, these ETFs would be the place to start. PowerShares NASDAQ Internet Portfolio (NASDAQ: PNQI ) – 7.47% weighting While this ETF has the largest weighting of Netflix stock in its portfolio, it shouldn’t be too surprising given how concentrated this portfolio is. It has 95 positions in the portfolio, but the top 10 holdings account for 60% of the fund’s assets. In fact, NFLX is only the 5th largest holding. Despite its significant weight in Netflix, this ETF still performed comparably to the NASDAQ on Thursday. It was up 1.3% compared to the NASDAQ 1.8% gain. SPDR Morgan Stanley Technology ETF (NYSEARCA: MTK ) – 6.04% weighting In this ETF, Netflix is the top dog. With just 37 holdings, this fund is also concentrated but weightings tend to be distributed a little more evenly. This fund has the added benefit of also being one of the cheapest. Its 0.35% expense ratio falls well below the 0.59% average ETF ratio. The heavy Netflix weighting helped weigh down this ETF’s performance Thursday. It managed a gain of just 0.3% on a day when technology stocks as a whole moved broadly higher. First Trust DJ Internet Index ETF (NYSEARCA: FDN ) – 5.44% weighting Another concentrated technology ETF, this fund has nearly 60% of assets in its top 10, and Netflix is just the 3rd largest holding here. This fund is easily the largest among the ETFs on this list at nearly $3.6 billion in assets, so this fund will be the most liquid and easiest to trade. This ETF nearly matched the pace of the NASDAQ on Thursday, rising nearly 1.5%. First Trust ISE Cloud Computing Index ETF (NASDAQ: SKYY ) – 4.47% weighting As an ETF index provider, ISE is probably better known for the PureFunds ISE Cyber Security ETF (NYSEARCA: HACK ) that’s garnered over $1 billion in assets in a short period of time, but this fund is slowly gaining notoriety in its own right. This fund’s composition is fairly similar to the Dow Jones Internet Index Fund – concentrated and roughly equal weighted – but it’s significantly smaller and hasn’t performed nearly as well. This fund wasn’t hit terribly hard by its Netflix position as it still delivered a 1.5% gain on Thursday. Ark Web x.0 ETF (NYSEARCA: ARKW ) – 3.88% weighting Here’s where we start getting into the really small ETFs. This fund has just $12 million in assets and is very thinly traded. Typically, trading just a few hundred shares a day, liquidity is a significant issue, and the costs of trading may be too high. Despite the fact that ARKW is about a year old but hasn’t really caught on it still makes the list for its large position in Netflix. This is the only ETF on the list that was actually down on Thursday. Ark Innovation ETF (NYSEARCA: ARKK ) – 2.83% weighting This ETF also from the Ark Investment Management family is even smaller than the one listed above with just $8 million in assets. Pretty much everything mentioned above with the Web x.0 ETF applies here as well. This fund manages to eke out a tiny gain on Thursday based on just one 100 share trade.
Principal Solar – A Silk Purse Or A Sow’s Ear?

Principal Solar is on schedule to build the largest solar farm east of the Rockies. Principal Solar has tremendous potential in terms of expanding its solar utility distribution because of backing by wealthy investors. Principal Solar’s stock has significantly underperformed its competition. On June 1, I wrote an article on Principal Solar’s ( OTCPK:PSWW ) business strategy as the “world’s first distributed solar utility.” The company had issued a series of press releases announcing its plans. Starting on Feb. 4, 2015, it announced that it was building the largest solar project east of the Rockies, which was followed on March 9, 2015, by news that a second, equally large plant would be built in North Carolina. (See company press releases at principalsolar.com for more details.) PSWW then attempted to attract investors when a proposed IPO was announced on May 20, 2015, and an S-1 was filed with the SEC seeking to raise $27.5 million. On June 5, 2015, management announced a reverse 1:4 stock split. When these tactics didn’t work, management lowered the IPO to $12 million. When that proved unsuccessful in generating finds, management withdrew the IPO. One of the interesting notations in this article was that “The Dallas energy company [Principal Solar], backed by oil billionaire Ray Hunt.” Interestingly, a separate article on Bizjournals.com notes the following: A Nov. 3 date has been set for a hearing on whether to confirm a plan that could eject Energy Future Holdings from bankruptcy by allowing the Dallas-based energy giant to sell its transmission utility Oncor to a consortium led by Hunt Consolidated Energy. Ray Hunt’s son, Hunter, is CEO of Hunt Consolidated Energy. In a deal valued at about $19 billion, Energy Future’s revised plan calls for selling Oncor to a consortium that includes its junior creditors, Hunt Consolidated, the Teacher Retirement System of Texas and investment firms Anchorage Capital Group, Arrowgrass Capital Partners, Avenue Capital Group, BlackRock and Centerbridge Partners. As I mentioned in my June article: Texas has plenty of rich investors. With 93 billionaires with a combined net worth of $493.5 billion, California has the highest number of Forbes 400 members. New York claims the second spot with 65 members, followed by Texas (39), Florida (31), and Illinois (17). So a silk purse is PSWW’s relationship with Hunt, which in turn seems to have the connections to attract additional high-worth investors. On Aug. 26, Principal Solar issued its latest press release, which states: PSWW has agreed to terms to co-develop its first major solar asset with affiliates of Entropy Investment Management, LLC (‘Entropy’). The 100MW facility, located in Cumberland County, North Carolina, will produce enough electricity to power approximately 20,000 average American homes. Construction began the week of Aug. 17, 2015, and the project is expected to begin generating power before the end of 2015. In the transaction, PSI will continue to play an important role in completing the project’s development phase and sold its interest in the project to affiliates of Entropy. PSWW seems to be changing its contractors. A company press release from May 11, 2015, stated that Alpha Energy would be its contractor to build the Cumberland solar farm. Initially, PSWW announced that Spanish firm Isolux Corsan as its engineering, procurement and construction contractor. Additional confusion comes from a Feb. 5, 2015, article in CleanTechnica.com : Principal Solar acquired the right to develop the project from Innovative Solar Systems, LLC of Asheville, North Carolina. The acquisition of the project is expected to close no later than June 3, 2015, with construction to be completed in early 2016. In July, I phoned John Green, managing partner of Innovation Solar Solutions, and he told me that all contracts have been signed and the project was on schedule. So here are my big questions: Why did the company announce that it expected to close the deal on June 3 and never make the announcement, even though a month later John Green said the project was proceeding and on schedule? Why did management wait until Aug. 26, nine days after construction began and two months after the failed IPO and plummeting stock? Why is PSWW down from a high of $35.60 in April to close at $1 on Tuesday? I don’t want to speculate, but I thought executives of companies did everything they could to prop up the price of stock for investors. I would like to understand these questions, but emails to PSWW’s CEO, CFO, and VP went unanswered. Principal Solar is competing against some heavyweights in the solar power utility market — Solar City (NASDAQ: SCTY ), TerraForm Power (NASDAQ: TERP ), Canadian Solar, and First Solar ( OTCQB:FLSR ). However, TERP is down from about $40 per share in July to close at $21.63 on Tuesday. SCTY is down from $60 per share in August to $50.10 on Tuesday, and FLSR is down from $53 in June to $49 on Tuesday. Yet PSWW is down from $35.60 to $1. Principal Solar is a silk purse when it comes to investor potential, primarily through Hunt. If Hunt acquires Oncor, there are significant opportunities for PSWW. Hunt Consolidated would own Oncor and Ray Hunt, who is the father of Hunter Hunt, CEO of Hunt Consolidated, is a backer of PSWW. According to the Oncor website: Oncor is a regulated electric distribution and transmission business that uses superior asset management skills to provide reliable electricity delivery to consumers. Oncor operates the largest distribution and transmission system in Texas, providing power to 3 million electric delivery points over more than 103,000 miles of distribution and 15,000 miles of transmission lines. From an investor standpoint, PSWW certainly looks like a sow’s ear at this time. But the deep pockets and strategy of the company executives could turn the stock into a silk purse. The man question is whether stock investors will buy the incongruous events and look to the future. Editor’s Note: This article covers one or more stocks trading at less than $1 per share and/or with less than a $100 million market cap. Please be aware of the risks associated with these stocks. Disclosure: I/we have no positions in any stocks mentioned, and no plans to initiate any positions within the next 72 hours. (More…) I wrote this article myself, and it expresses my own opinions. I am not receiving compensation for it (other than from Seeking Alpha). I have no business relationship with any company whose stock is mentioned in this article.

Best And Worst Q3’15: Large Cap Blend ETFs, Mutual Funds And Key Holdings

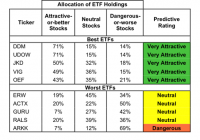
Summary Large Cap Blend style ranks second in Q3’15. Based on an aggregation of ratings of 56 ETFs and 848 mutual funds. DDM is our top-rated Large Cap Blend ETF and CMIIX is our top-rated Large Cap Blend mutual fund. The Large Cap Blend style ranks second out of the 12 fund styles as detailed in our Q3’15 Style Ratings for ETFs and Mutual Funds report. It gets our Attractive rating, which is based on an aggregation of ratings of 56 ETFs and 848 mutual funds in the Large Cap Blend style. See a recap of our Q2’15 Style Ratings here. Figures 1 and 2 show the five best and worst-rated ETFs and mutual funds in the style. Not all Large Cap Blend style ETFs and mutual funds are created the same. The number of holdings varies widely (from 18 to 1334). This variation creates drastically different investment implications and, therefore, ratings. Investors seeking exposure to the Large Cap Blend style should buy one of the Attractive-or-better rated ETFs or mutual funds from Figures 1 and 2. Figure 1: ETFs with the Best & Worst Ratings – Top 5 (click to enlarge) * Best ETFs exclude ETFs with TNAs less than $100 million for inadequate liquidity. Sources: New Constructs, LLC and company filings The Arrow QVM Equity Factor ETF (NYSEARCA: QVM ) is excluded from Figure 1 because its total net assets are below $100 million and do not meet our liquidity minimums. Figure 2: Mutual Funds with the Best & Worst Ratings – Top 5 (click to enlarge) * Best mutual funds exclude funds with TNAs less than $100 million for inadequate liquidity. Sources: New Constructs, LLC and company filings The ProShares Ultra Dow 30 ETF (NYSEARCA: DDM ) is the top-rated Large Cap Blend ETF and the Calvert Large Cap Core Portfolio (MUTF: CMIIX ) is the top-rated Large Cap Blend mutual fund. Both earn our Very Attractive rating. The Ark Innovation ETF (NYSEARCA: ARKK ) is the worst-rated Large Cap Blend ETF and the Virtus Equity Trend Fund (MUTF: VAPAX ) is the worst-rated Large Cap Blend mutual fund. ARKK earns our Dangerous rating and VAPAX earns our Very Dangerous rating. Qualcomm (NASDAQ: QCOM ), is one of our favorite stocks held by Large Cap Blend funds and earns our Very Attractive rating. Since 2010, Qualcomm has grown after-tax profit ( NOPAT ) by an impressive 29% compounded annually. Over this same time frame, Qualcomm’s already top quintile return on invested capital ( ROIC ) has improved from 31% to 54%. In addition, Qualcomm’s NOPAT margin has increased from 23% to 26%. Qualcomm is becoming more efficient and profitable but the stock does not reflect these advancements. At its current price of $62/share, Qualcomm has a price to economic book value ( PEBV ) ratio of 0.8. This ratio implies that the market expects Qualcomm’s NOPAT to permanently decline by 20% from current levels. If Qualcomm can grow NOPAT by just 4% compounded annually over the next five years , the stock is worth $87/share ­- a 40% upside. Amazon.com (NASDAQ: AMZN ) is one of our least favorite stocks held by Large Cap Blend funds and earns our Dangerous rating. Since peaking in 2010, Amazon’s NOPAT has declined by 28% compounded annually. Its ROIC has fallen from 31% to a bottom quintile 2% over the same time frame. We’ve previously written on Amazon’s free cash flow issues , which have only worsened as Amazon had -$7 billion in free cash flow in 2014. Despite the issues, bulls continue to propel AMZN higher, and it is up 47% year to date, which leaves it significantly overvalued. To justify its current price of $535, Amazon must grow NOPAT by 28% compounded annually over the next 23 years . This scenario also assumes Amazon is able to maintain its pre-tax (NOPBT) margin at 1%, a level it has not been able to maintain in recent years. We think the expectations embedded in AMZN are out of touch with reality. Figures 3 and 4 show the rating landscape of all Large Cap Blend ETFs and mutual funds. Figure 3: Separating the Best ETFs From the Worst Funds (click to enlarge) Sources: New Constructs, LLC and company filings Figure 4: Separating the Best Mutual Funds From the Worst Funds (click to enlarge) Sources: New Constructs, LLC and company filings D isclosure: David Trainer and Kyle Guske II receive no compensation to write about any specific stock, style, style or theme. Disclosure: I/we have no positions in any stocks mentioned, and no plans to initiate any positions within the next 72 hours. (More…) I wrote this article myself, and it expresses my own opinions. I am not receiving compensation for it. I have no business relationship with any company whose stock is mentioned in this article.