Tag Archives: history

S&P 500 Again Shows Weakness: Go Short With These ETFs

After the furious rally since February 12, the S&P 500 has again lost momentum and slipped into the red from a year-to-date look. This is especially true, as investors are apprehensive as to whether the stocks will be able to sustain their gains in the coming weeks given the bleak corporate earnings picture and renewed concerns on global growth uncertainty (read: Top and Flop Zones of Q1 and Their ETFs ). As we are heading into a weak Q1 earnings season, volatility is expected to increase though stabilization in energy prices and the dollar could act as a catalyst. According to the Zacks Earnings Trend , earnings growth will be deep in the negative territory for the fourth consecutive quarter with 10.9% estimated decline. In fact, the magnitude of negative Q1 revisions was the highest among recent quarters with 14 out of the 16 Zacks’ sectors witnessing negative revisions over the past three months. Utilities and retail were the only two exceptions. Revenues will likely be down 2.2% on modestly lower net margins. The release of minutes this week showed that the Fed is unlikely to raise interest rates in April, signaling that weak global growth could hurt the ongoing recovery in the U.S. economy. Further, continued rise in the Japanese currency dampened investors’ faith in central banks’ ability to boost growth across the globe. All these factors coupled with relatively higher valuations have led to risk-off trade, pushing the safe havens higher (read: Q1 ETF Asset Report: Safe Havens Pop; Currency Hedged Drop ). Added to the downbeat note is the International Monetary Fund warning. The agency stated that problems in emerging markets, such as China, could lead to poor stock performance in the U.S. and other developed countries. Given this, the S&P 500 will likely see rough trading ahead and investors could easily tap this opportune moment by going short on the index. There are a number of inverse or leveraged inverse products in the market that offer inverse (opposite) exposure to the index. Below, we highlight those and some of the key differences between each: ProShares Short S&P500 ETF (NYSEARCA: SH ) This fund provides unleveraged inverse exposure to the daily performance of the S&P 500 index. It is the most popular and liquid ETF in the inverse equity space with AUM of nearly $2.5 billion and average daily volume of nearly 7 million shares. The fund charges 90 bps in annual fees. ProShares UltraShort S&P500 ETF (NYSEARCA: SDS ) This fund seeks two times (2x) leveraged inverse exposure to the index, charging 91 bps in fees. It is also relatively popular and liquid having amassed nearly $2 billion in AUM and more than 13.5 million shares in average daily volume. ProShares Ultra S&P500 ETF (NYSEARCA: SSO ) With AUM of $1.6 billion, this fund also seeks to deliver twice the return of the S&P 500 Index, charging investors 0.89% in expense ratio. It trades in solid volumes of more than 4.6 million shares a day on average. ProShares UltraPro Short S&P500 (NYSEARCA: SPXU ) Investors having a more bearish view and higher risk appetite could find SPXU interesting as the fund provides three times (3x) inverse exposure to the index. Though the ETF charges a slightly higher fee of 93 bps per year, trading volume is solid, exchanging more than 6.6 million shares per day on average. It has amassed $728.3 million in its asset base so far. Direxion Daily S&P 500 Bear 3x Shares (NYSEARCA: SPXS ) Like SPXU, this product also provides three times inverse exposure to the index but comes with 2 bps higher fees. It trades in solid volume of about 6.6 million shares and has AUM of $476.8 million. Bottom Line As a caveat, investors should note that such products are suitable only for short-term traders as these are rebalanced on a daily basis. Still, for ETF investors who are bearish on the equity market for the near term, either of the above products could make an interesting choice. Clearly, a near-term short could be intriguing for those with high-risk tolerance, and a belief that the “trend is the friend” in this corner of the investing world. Original Post
Avoiding Cigarette Butts

Too many investors hang their hat on investments that seem “cheap”. Unfortunately, too often something that looks like a bargain turns out to be a cigarette butt from which investors are hoping to take a last puff. As the old adage states, “you get what you pay for,” and that certainly applies to the world of investments. There are endless examples of cheap stocks getting cheaper, or in other words, stocks with low price/earnings ratios going lower. Stocks that appear cheap today, in many cases turn out to be expensive tomorrow because of deteriorating or collapsing profitability. For instance, take Haliburton Company (NYSE: HAL ), an energy services company. Wall Street analysts are forecasting the Houston, Texas based oil services company to achieve 2016 EPS (earnings per share) of $0.32, down -79%. The share price currently stands at $37, so this translates into an eye-popping valuation of 128x P/E ratio, based on 2016 earnings estimates. What has effectively occurred in the HAL example is earnings have declined faster than the share price, which has caused the P/E to go higher. If you were to look at the energy sector overall, the same phenomenon is occurring with the P/E ratio standing at a whopping 97x (at the end of Q1). These inflated P/E ratios are obviously not sustainable, so two scenarios are likely to occur: The price of the P/E (numerator) will decline faster than earnings (denominator) The earnings of the P/E (denominator) will rise faster than the price (numerator) Under either scenario, the current nose-bleed P/E ratio should moderate. Energy companies are doing their best to preserve profitability by cutting expenses as fast as possible, but when the product you are selling plummets about -70% in 18 months (from $100 per barrel to $30), producing profits can be challenging. The Importance of Price (or Lack Thereof) Similarly to the variables an investor would consider in purchasing an apartment building, “price” is supreme. With that said, “price” is not the only important variable. As famed investor Warren Buffett shrewdly notes, the quality of a company can be even more important than the price paid, especially if you are a long-term investor. “It’s far better to buy a wonderful company at a fair price than a fair company at a wonderful price.” The advantage of identifying and owning a “wonderful company” is the long-term stream of growing earnings. The trajectory of future earnings growth, more than current price, is the key driver of long-term stock performance. Growth investor extraordinaire Peter Lynch summed it up well when he stated, ” People Concentrate too much on the P, but the E really makes the difference.” Albert Einstein identified the power of “compounding” as the 8th Wonder of the World, which when applied to earnings growth of a stock can create phenomenal outperformance – if held long enough. Warren Buffett emphasized the point here: “If you aren’t willing to own a stock for ten years, don’t even think about owning it for ten minutes. Put together a portfolio of companies whose aggregate earnings march upward over the years, and so also will the portfolio’s market value.” Throw Away Cigarette Butts I have acknowledged the importance of aforementioned price, but your investment portfolio will perform much better, if you throw away the cigarette butts and focus on identifying market leading franchise that can sustain earnings growth. The lower the growth potential, the more important price becomes in the investment question. (see also Magic Quadrant ) Here are the key factors in identifying wining stocks: Market Share Leaders : If you pay peanuts, you usually get monkeys. Paying a premium for the #1 or #2 player in an industry is usually the way to go. Certainly, there is plenty of money to be made by smaller innovative companies that disrupt an industry, so for these exceptions, focus should be placed on share gains – not absolute market share numbers. Proven Management Team : It’s nice to own a great horse (i.e., company), but you need a good jockey as well. There have been plenty of great companies that have been run into the ground by inept managers. Evaluating management’s financial track record along with a history of their strategic decisions will give you an idea what you’re working with. Performance doesn’t happen in a vacuum, so results should be judged relative to the industry and their competitors. There are plenty of incredible managers in the energy sector, even if the falling tide is sinking all ships. Large and/or Growing Markets : Spotting great companies in niche markets may be a fun hobby, but with limited potential for growth, playing in small market sandboxes can be hazardous for your investment health. On the other hand, priority #1, #2, and #3 should be finding market leaders in growth markets or locating disruptive share gainers in large markets. Finding fertile ground on long runways of growth is how investors benefit from the power of compound earnings. Capital Allocation Prowess: Learning the capital allocation skillset can be demanding for executives who climb the corporate ladder from areas like marketing, operations, or engineering. Regrettably, these experiences don’t prepare them for the ultimate responsibility of distributing millions/billions of dollars. In the current low/negative interest rate environment, allocating capital to the highest return areas is more imperative than ever. Cash sitting on the balance sheet earning 0% and losing value to inflation is pure financial destruction. Conservatism is prudent, however, excessive piles of cash and overpaying for acquisitions are big red flags. Managers with a track record of organically investing in their businesses by creating moats for long-term competitive advantage are the leaders we invest in. Many so-called “value” investors solely use price as a crutch. Anyone can print out a list of cheap stocks based on Price-to-Earnings, Enterprise Value/EBITDA, or Price/Cash Flow, but much of the heavy lifting occurs in determining the future trajectory of earnings and cash flows. Taking that last puff from that cheap, value stock cigarette butt may seem temporarily satisfying, but investing into too many value traps may lead you gasping for air and force you to change your stock analysis habits. DISCLOSURE: Sidoxia Capital Management (SCM) and some of its clients hold positions in certain exchange traded funds (ETFs), but at the time of publishing had no direct position in HAL or any security referenced in this article. No information accessed through the Investing Caffeine (IC) website constitutes investment, financial, legal, tax or other advice nor is to be relied on in making an investment or other decision. Please read disclosure language on IC Contact page.

Growth And Surging Popularity Of Unconstrained Bond Funds

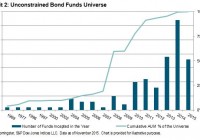
By Hong Xie In the aftermath of the global financial crisis of 2007-2008, one noticeable trend in fixed income investment is the growth and popularity of unconstrained bond funds. They have generated strong interest in the investment industry due to the flexibility they offer in duration management and the broader investment universe. Because they are not managed against a specific benchmark, unconstrained bond funds may also pose challenges for investors in understanding and measuring their performance. The global financial crisis of 2007-2008 and the economic recession that followed prompted unprecedented quantitative easing monetary policies across many countries. Not only were short-term interest rates lowered to either zero or close to zero, but quantitative easing was also adopted in places such as the U.S., the U.K., the eurozone, and Japan to flatten the yield curve and keep long-term interest rates low. As the U.S. economy continues to recover and the Fed starts to increase interest rates, many investors have concerns about holding core fixed income products with high interest-rate risk in a rising-rate environment. It is this widespread market sentiment that has driven the surging popularity of unconstrained bond funds, which offer wide latitude to fund managers on duration management and investment selection. We use fund data from Morningstar to gauge the size and growth of unconstrained bond funds. In particular, we screen for funds categorized as “U.S. OE Nontraditional Bonds” by Morningstar, while excluding those with mandates in specific sectors or with duration constraints. As of November 2015, there were 122 open-ended mutual funds with total assets under management (AUM) of USD 140 billion in our data set, in comparison with 19 funds with AUM of USD 9 billion at the end of 2008 (see Exhibit 1). Even though the first fund started in 1969, it wasn’t until after the global financial crisis of 2007-2008 that unconstrained bond funds started gaining traction among investors. Exhibits 1 and 2 show the rapid growth of unconstrained bond funds since 2008 in terms of both AUM and number of funds. Disclosure: © S&P Dow Jones Indices LLC 2015. Indexology® is a trademark of S&P Dow Jones Indices LLC (SPDJI). S&P® is a trademark of Standard & Poor’s Financial Services LLC and Dow Jones® is a trademark of Dow Jones Trademark Holdings LLC, and those marks have been licensed to S&P DJI. This material is reproduced with the prior written consent of S&P DJI. For more information on S&P DJI and to see our full disclaimer, visit www.spdji.com/terms-of-use .