Tag Archives: freedom

A Case For Active Investment Management

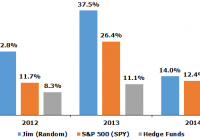
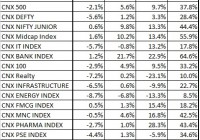
Summary Investing in fundamentally strong companies. Active Management vs. Benchmarking. Potential for reduced exposure to declining markets. “The most successful investment managers generally possess three qualities: independent thought, discipline, and consistency of application” – John Train in his book The Money Masters. “It is impossible to produce superior performance unless you do something different from the majority.” – Sir John Templeton. Screening for Fundamentally Strong Companies For over 15 years I have been a multi-asset class investor, advisor and analyst. My teams over the years have managed a variety of active strategies. While different in focus, every equity based strategy incorporates fundamental investment principles. Regardless of the fad of the day or the hot company everyone is talking about, consistent performance and risk management depends on these principles. I have recently collaborated with a group of CFA charterholders to form an all-cap equity strategy from our most successful strategies with the sole purpose of generating exceptional risk adjusted returns. Below is a summary of the parameters we use. All Alpha Strategy Parameters Price to Book < 1.5 7 years of positive operating margin 3 years roe > 15% Lowest 20% of growth adjusted free cash flow multiple Companies with above average operating and net margin within their respective industry Below average debt to equity Positive cash flow ROA growing D/E declining Current ratio, gross margin, asset turnover growing Cash flow > net income Consistent earnings growth Momentum parameters Thanks to Henry Crutcher and Equities Lab for creating a great quantitative tool that enables us to generate and successfully back test the performance of our fundamental and technical based strategies for the periods we don’t have actual trading history. See the output since 1997 from the program below. Here is a list of every trade for the past 15 years. Recently passing companies: (click to enlarge) The results from the model were strong. Upon verifying the data, 13.12% annualized is accurate. I then combined it with a proprietary risk management model that helps us anticipate significant market declines and the results were even more encouraging. I nvesting in fundamentally strong companies Investing “is pursued most successfully in a simple, straightforward way.” – Brad Perry, Winning the Investment Marathon. Buy stocks of high-quality companies at good prices and continue holding them as long as the companies’ performance merits doing so. Do this consistently and the probability an investor will enjoy above average returns substantially increases. Below are brief descriptions of the investment parameters. 1. Price to Book < 1.5 As a primary measure of value, the price to book ratio is an initial screen that seeks to pass securities that have moved away from their true value due to neglect and are typically out of favor. These securities over time have proven to be successful investments. 2. 7 years of positive operating margin Consistent operating margins are a positive sign a company's underlying business is successful and seemingly sustainable. 3. 3 years roe > 15% Strong and consistent return on equity is essential. 4. Lowest 20% of growth adjusted free cash flow multiple Using price/free cash flow multiplied by 5 year growth of free cash flow is a valuation measure. 5. Companies with above average operating and net margin within their respective industry This measure helps us choose the leaders in each investment’s respective industry. 6. Below average debt to equity Because overleveraged companies are not attractive. 7. ROA growing We prefer the companies we invest in to get better at what they do over time. Additionally, we look for companies that invest internally and that return produces consistently growing ROA. Otherwise, our money is better invested elsewhere. This is a year over year measure. 8. D/E declining Efficient use of debt is important, as well as consistent retirement of debt. 9. Current ratio, gross margin, asset turnover growing Measures of liquidity, profitability and business activity. 10. Cash flow from Operations > net income This is a simple accrual accounting check to avoid companies that may be attempting to manage earnings. 11. Consistent earnings growth Earnings growth attracts attention. We again use year over year measures that help us identify companies that are poised to move. 12. Momentum parameters in the form of relative strength play an important role in our growth oriented screen. It helps identify companies with attractive price movement but remain appropriately valued. In addition, we tend to focus our attention to price movers that are within 15% of recent highs. Active Management vs. Benchmarking So I guess you now have me pegged as an active investor. I personally don’t consider myself active or passive, I consider myself a fundamentally based technical investor, meaning I buy when it makes sense and sell when things start looking uncertain. My current domestic exposure, managed with a beta weighted futures overlay on a long portfolio, is 100% hedged due to current volatile economic conditions. The exposure metric was derived by analyzing market valuations and economic indicators. It is updated monthly, which may also be considered an actively managed strategy. Regardless of my bias, active management has taken a beating over the past few years and rightfully so, in many instances, such as the “active” managers that are more concerned about underperforming than actually providing value to their clients. In other cases, active management can provide an investor peace of mind and tremendous value if the strategy is fundamentally sound and is implemented consistently. William Sharpe stated in the Arithmetic of Active Management (The Financial Analysts’ Journal Vol. 47, No. 1, January/February 1991. pp. 7-9): If “active” and “passive” management styles are defined in sensible ways, i t must be the case that 1. before costs, the return on the average actively managed dollar will equal the return on the average passively managed dollar and 2. after costs, the return on the average actively managed dollar will be less than the return on the average passively managed dollar The problem with this statement from William Sharpe is that it assumes the active manager seeks to benchmark a specific market such as large cap, small cap, etc. As a business, active managers live and die on performance against their respective benchmarks. Knowing this, many use enhanced benchmarking. Enhanced benchmarking involves an active manager investing in an essentially passive portfolio of securities that mimic a benchmark. However in addition to this passive allocation, these active managers will use derivatives or some other portable alpha to “enhance” portfolio performance in an attempt to reduce the risk of underperforming the benchmark and providing the possibility of outperforming at any random time. Additionally, active managers may also stray from their benchmark allocations by adding smaller cap and potentially higher returning securities. This is known as style drift and measured by tracking error. Oftentimes, these additional measures do not add sufficient alpha to offset higher risk and fees. These are reasons a high percentage of active managers perform poorly after fees compared to passive index investing. Potential for reduced exposure to declining markets As seen in the Business Cycle Overlay data, the potential for reduced exposure to declining markets can be substantial if executed properly. The model effectively reduces equity risk when valuations become rich and economic conditions warrant more caution. Returns from effectively managing downturns is termed the buy-and-hold equalizer. The buy-and-hold equalizer (Why Market Timing Works, Journal of Portfolio Management, Summer 1997), represents the increased leverage an active investment strategy gains by preserving capital during a market drop. The more money an investor has to invest when the market turns up, the greater the performance leverage. The following passage is from NAAIM . When properly implemented, active management strategies should lessen an investor’s exposure to declining markets, blunting the impact of bear markets and preserving capital and the majority of prior gains. Moving out of the market prior to the majority of a decline means you have more money to invest when the market heads upward. Active investment management is most effective over a full market cycle (3 to 5 years). The reality of down markets provides the rational for active management. Down markets hurt investors in a number of ways. First, the more investors lose money in a down market, the more they lose valuable time and opportunity. Over the past 70 years, the major indices spent nearly 60% of the time sitting out bear markets and then returning to earlier highs. Only about 40% of the time were real gains being made. Through the use of active management strategies, money managers seek investment approaches that moderate the volatility of the market, helping investors stay the course and benefit from the long-term gains of the market and improve risk adjusted returns. Additionally, active management offers potential benefits beyond performance. Unlike with passive approaches, active managers are not required to invest cash inflows at the time of receipt when market conditions or prices may not be conducive. They can screen for quality and use buy/ sell triggers as a means of reducing risk. While a passive manager must own everything in an index, an active managers have the freedom to look for attractive stocks across the targeted universe. Summary Active management is an effective tool if used properly. It can not only lead to larger gains, but also reduce risk. However, it is very important for investors to understand the underlying investment strategy of a particular investment regardless of whether it is active or passive. Moreover, an investor should compare the statistics of an active strategy (Total Return, Standard Deviation, Calmar Ratio, Sharpe Ratio, Information Ratio, and Tracking Error) to that of a similar passive to determine if the higher fees are producing sufficient additional gains to warrant an investment. I will follow up this article with regular investment and economic analysis specific to these strategies, highlighting passing companies and providing economic rationale for managing an investment portfolio. Follow me to stay informed.

Intelligent Investing Is (Literally) Child’s Play!

Summary In any large group of investors, some are bound to have outperformed simply by pure chance – it does not prove that they are skilled. The fact that even children and pets can outperform professional fund managers proves that luck is what mainly drives investment results. Even buying stocks you understand, as advocated by Warren Buffett, does not lead to superior investment performance. Stocks selected at random perform just as well – and often times even better – than stocks carefully selected by the so-called “experts.”. The common wisdom is that the more time one spends researching stocks, the better one’s investment results will be. But if this was true, then why do actively managed funds consistently underperform the market? Many of these funds spend enormous resources on research in an attempt to uncover the best stocks, and yet their performance is often surpassed by blindfolded monkeys throwing darts at a stock board. How can this be? How much of a role does luck play in investment success? This article will attempt to answer these important questions. Everyone is Above Average in their Own Minds Overconfidence refers to the human tendency to overestimate one’s own abilities and knowledge relative to others. This is sometimes called the “Lake Wobegon Effect” – a fictional town where all the women are strong, all the men are good looking, and all the children are above average. In the real world, for instance, 84% of Frenchmen feel that their lovemaking abilities put them in the top half of French lovers. And in the U.S., 93% of people believe their driving skills put them in the top 50% of U.S. drivers (although it does make me curious about how bad the last 7% of drivers are – they are probably dead by now). To see how prevalent the Lake Wobegon Effect (i.e., overconfidence) was in the financial markets, I once conducted a survey asking professional traders at a large, proprietary trading firm to rank their trading skills as either “below” or “above” average compared to their peers at the firm. Out of the 87 participants, 84 rated themselves as above average. This, of course, is a mathematical impossibility since only half of them, not 97%, can be better than average. Curiously enough, though, many of these “above average” traders ended up blowing up during the 2008 financial crisis. Their overconfidence led to massive risk-taking, which caused their eventual downfall. But in addition to irrational risk taking, overconfidence also leads to excessive trading. There are two major problems with overtrading: the first, and the most obvious problem, is that it increases taxes and trading fees; and second, the shares that individual traders sell, on average, do better than those they buy, by a very substantial margin. Essentially, this means that less really is more when it comes to trading. This is why the best predictor of future performance is the level of turnover, not pursuit of specific investment styles/philosophies. Perhaps Winnie-the-Pooh put it best when he said “Never underestimate the value of doing nothing.” More people should heed this advice. Luck is More Important than Skill (in Investing) Not only does overconfidence led to excessive trading and risk taking, it also makes people blind to the fact that investing – like casino gambling – is largely a game of luck. This is why past investment track records are less relevant than what most people think. Since there are literally tens of millions of investors in the world, it is a statistical certainty that a very tiny percentage of them will become a Warren Buffett or a George Soros. Likewise, if there were an equal number of coin-flippers, a few would, by pure chance alone, flip heads 20 or more times in a row – it does not prove that they are skilled coin-flippers. Because luck is what mostly determines success, the type of investment style/philosophy employed (e.g., value, growth, momentum, etc.) is of little importance. Buffett’s approach, for instance, is to buy undervalued stocks and wait for them to appreciate to fair value; conversely, Soros does not pay too much attention to valuation – he is famous for making some of his largest trading decisions based on nothing more than how much his back is hurting that day. Although using completely opposite investment approaches, both Buffett and Soros were still able to amass huge fortunes. This shows that, with luck on one’s side, literally any investment strategy can work. In fact, even random stock selection – like a blindfolded monkey throwing darts at a stock board – gives one as good a chance at beating the market as any other strategy. Interestingly enough, most of the time the monkeys actually perform better than the so-called “professionals,” probably because they have lower turnover and charge lower fees (bananas are pretty cheap). A few years ago, I began conducting a random stock picking experiment. I enlisted the help of my trusty five-year old sidekick Jimmy (or Jim as he prefers to be called). Jim was tasked with pulling 10 slips of paper at random out of a hat. Every slip of paper in the hat had a ticker symbol on it – there were 500 slips in total (each representing one company in the S&P 500 index). I then created a portfolio that is equally invested in those 10 companies, and tracked their performance over the course of a year. This experiment was conducted for three consecutive years (2012-2014), with the results show below. Exhibit 1: Random Stock Selection Outperforms Most Hedge Funds Note: (1) Jim picked a new set of stocks at the start of every year, which means his portfolio was completely rebalanced once per year. (2) The performance returns exclude dividends paid. Source: A North Investments, State Street Global Advisors, Barclay Hedge Fund Index The performance was impressive to say the least. Jim’s random stock picks significantly outperformed both the SPDR S&P 500 ETF (NYSEARCA: SPY ) as well as the average hedge fund for three consecutive years. But Jim’s outperformance is not surprising or unique – even non-humans can do it! Back in 2012, a ginger cat named Orlando had managed to outperform many fund managers. The cat simply selected stocks by throwing his favorite toy mouse on a grid of numbers allocated to different companies. In another funny example, a Russian circus chimpanzee named Lusha picked stocks that tripled in value over a year’s time. Lusha was presented with cubes representing 30 different stocks and selected eight to invest money in by picking the cubes. Her chosen portfolio outperformed 94% of Russian investment funds! The undeniable fact that children and pets can outperform professional fund managers proves beyond a shadow of a doubt that luck is what mainly drives investment results. If investing truly did involve skill, then the professionals would consistently outperform – just like we can expect a world-class chess grandmaster to consistently beat even the luckiest amateur chess player. Rather than seeking expert advice, then, most people are better off investing their savings by selecting stocks at random or by buying into an index fund or ETF which tracks a reputable selection of securities. Not only does this reduce long term risk, it also saves paying fees to fund managers with seven-figure salaries and hefty bonuses. For those who are interested (or perhaps have no children or pets to help them pick stocks), below I have provided a list of Jim’s random stock picks for 2015. I am willing to bet that little Jim’s portfolio will once again outperform the average high-fee-charging hedge fund! Exhibit 2: Jim’s Random Stock Picks for 2015 Source: A North Investments The Futility of Equity Research One of Buffett’s personal investing rules (right after “never lose money”) is to only buy companies you understand. This sounds like a very reasonable rule in theory. But as Yogi Berra once said, “In theory there is no difference between theory and practice; in practice there is.” In a way, Buffett seems to believe that having more knowledge about a company makes it easier to predict how much its intrinsic value (and its stock price) will change over time. This simply does not appear to be the case. Take, for instance, Google (NASDAQ: GOOG ) (NASDAQ: GOOGL ) founders Larry Page and Sergey Brin. Several years before Google’s massive IPO that made them both billionaires, they attempted to sell the whole company for a paltry $1.6 million. Luckily for them, no one in Silicon Valley was interested in buying the young company with its unique search technology. It can easily be said that nobody in the world possessed more knowledge about Google than its two founders, and even they could not predict the Google phenomenon (as the attempt to sell proves). It would then be foolish to believe that it is possible to make any better predictions about companies’ futures just by reading their old SEC filings. This explains why actively managed funds, even after spending millions of dollars and thousands of man-hours every year conducting detailed research in a futile attempt to find the best stocks, consistently underperform passive index funds and dart-throwing monkeys. As it is so often said, the definition of insanity is doing the same thing over and over and over again and expecting different results. That pretty well describes the actively managed fund industry. But what about small individual investors? There is a long-held belief that smaller investors have an advantage over the Wall Street crowd, since they are not subject to institutional constraints. Chief among these is the freedom to invest in small, thinly traded stocks, which research has shown tend to have higher returns than their larger counterparts. Still, I would argue that the future price behavior of each individual stock, regardless of size, always remains completely random and unpredictable – essentially making it impossible to consistently pick the best ones. In other words, smaller investors possess no advantage at all. To prove this empirically, I simply tracked the performance of every Seeking Alpha “Pro Top Idea” published during January 2014 (only the “long” recommendations). Not only are all of these relatively small companies, but they were specifically picked by the experts as the best stock ideas with the most near-term upside potential. These stock recommendations, 40 in total, were combined into an equally weighted portfolio, and the portfolio’s overall performance was tracked over the course of the year. The end results were even worse than expected. As shown below, the Pro Top Ideas even underperformed hedge funds, generating a negative return of 1.8% in 2014. Every single one of these 40 recommendations is extensively researched, well-written, and sounds very convincing, and yet these expert stock picks were easily outperformed by a child picking stocks at random out of a hat. To be fair, a small number of Pro Top Ideas did generate impressive 30%+ returns; however, any set of 40 randomly selected stocks will also contain a few that will provide similar returns, there is no need to waste time conducting research on them. Exhibit 3: Professional Stock Pickers Underperform Note: (1) Performance tracked from January 2, 2014 (the first trading day) to December 31, 2014 (the last trading day). (2) Only the “long” Pro Top Ideas were included; companies that were acquired during the year were excluded. Source: A North Investments, State Street Global Advisors, Barclay Hedge Fund Index, Seeking Alpha The main point is that no amount of research will make someone a better stock picker. It might sound counterintuitive, but the empirical evidence is overwhelmingly in support of this conclusion. This is because the price behavior of stocks is influenced by an infinite number of variables (most of them unknown), so attempting to predict which stocks will perform the best at any given time is impossible. It should also be noted that high subjective confidence (e.g., “high conviction stock picks” made by some suit-and-tie-wearing investment guru) is not to be trusted as an indicator of accuracy; if anything, low confidence could be more informative. Summary and Conclusion In any large group of investors, some are bound to have outperformed by pure chance alone – it does not prove that they possess skill. In other words, luck is what separates good investors from bad ones. But since luck has a tendency to revert to the mean in the long run, investing with a hotshot fund manager could be hazardous to one’s wealth. For this reason, most people are far better off investing their savings by selecting stock at random or by buying into a low-cost index fund or ETF which tracks a reputable selection of securities. This reduces risk and over time will produce higher after-tax returns. Disclosure: The author has no positions in any stocks mentioned, and no plans to initiate any positions within the next 72 hours. (More…) The author wrote this article themselves, and it expresses their own opinions. The author is not receiving compensation for it (other than from Seeking Alpha). The author has no business relationship with any company whose stock is mentioned in this article.

Tsunami Of Level 1 Indian ADRs Expected In U.S. OTC Markets

Summary The Indian finance ministry has allowed the issuance of sponsored and unsponsored Level 1 ADRs. DRs can be issued against any underlying permissible security such as equity, corporate debt, mutual funds, ETFs etc. Provides an exciting opportunity for overseas investors to invest in the Indian growth story. What are unsponsored ADRs? There are 4 types of American depository receipts, in increasing order of regulatory requirements: 1. Unsponsored ADRs 2. Sponsored Level 1 ADRs (OTC) 3. Sponsored Level 2 ADRs (listed) 4. Sponsored Level 3 ADRs (offering)… these were the only type of ADRs available for Indian companies. They have the most stringent regulatory requirements Level 1 and Level 2 ADRs have less stringent requirements than Level 3 ADRs, but all of them are sponsored (issued) by the issuer. In contrast, an unsponsored ADR is one in which there is no deposit agreement and no legal relationship between the depository bank and the issuer. There are no regulatory disclosure requirements for the issuer to comply with the Sarbanes-Oxley and no requirement to adhere to US GAAP requirements. In fact, an unsponsored ADR can be issued without the consent of the issuer. These instruments can be traded in the over-the-counter (OTC) markets in the United States. During the Union Budget of July 2014, Arun Jaitley, India’s Finance Minister, had accepted the Sahoo Committee’s recommendation for liberalization in ADR/GDR issues. As per the new Depository Receipts Scheme, a foreign depository bank is permitted to issue unsponsored ADRs for the first time. Since that announcement, BNY Mellon (NYSE: BK ) has confirmed that it has filed with the US SEC to establish several unsponsored depository receipts program from India. The proverbial home bias A US investor is more likely to invest a large proportion of his investments in domestic equities. This is mainly due to their familiarity with local regulations and settlement procedures. Also their investment mandate may force them to invest in only USD-denominated stocks. However, portfolio theory states that there are significant diversification benefits from investing in foreign equities as it lowers systemic risks from domestic factors. The credit crisis of 2007 and the various currency crisis that continue to occur over time shows that contagion spreads during a crisis. And the benefits of international diversification are considerably reduced during times of stress. But aside from these “Black swan events,” investment in foreign equities is likely to provide direct exposure to high-growth companies in emerging markets. What does it mean for investors in the US? Indian bourses have given returns in excess of 30% in the last one year. This has been on the back of positive sentiments arising due to the new business friendly prime minister. Also as per the latest economic indicators, it is likely that the economy is on a recovery path. This could lead to a multi-year bull run, similar to one seen in the US stock markets. In light of these very favorable circumstances, the announcement by the Indian finance minister to liberalize the ADR/GDR norms comes at a very appropriate time. I have listed below the sectoral returns from the Indian markets. A study by BNY Mellon notes that more than 50% of the Tier 2 and Tier 3 institutional investors ($1bn to $10bn in AUM) who wanted to invest in India did it through DRs as they couldn’t invest directly in India equities. These non capital-raising DRs will provide access to investors who can’t establish their Indian operations or who do not want to invest in equity derivatives or ETFs, but want to buy Indian equities in US-dollar denominated form. The Sahoo committee, which had proposed these policies, envisioned that there should be competitive neutrality, where all the economic agents (Indian or foreign investors and Indian or foreign firms) have the full freedom to invest/or issue DRs for permissible securities within the existing capital control regime. This freedom is given as long as the following two conditions are satisfied: 1) the permissible securities (as defined under the Securities Contracts Act), should be in dematerialized form and 2) DRs must be issued only in permissible jurisdictions. This is to make sure that interests of investors are protected and money is not laundered through these channels. Risks Before listing the key takeaways from the article, let’s first look at the risks involved in buying these securities. The biggest risk is if the depository banks are unable to attract sufficient liquidity in these OTC stocks. Volumes in unsponsored ADRs are far less than in sponsored ADRs. Hence the bid/ask spread is quite high. Low liquidity and high spreads make it difficult for investors to quickly enter or exit the stock. Investors who buy into these stocks also carry the risk of a fluctuating Indian rupee. Key Takeaways So here are the key takeaways: Unsponsored or sponsored Level 1 ADRs. DRs can be issued on any permissible security: equity, debt, MFs, ETFs, convertible debt etc. The DR can be issued for a listed or unlisted company. Conversion of DRs into underlying securities and vice versa is not taxable, since there is no change in beneficial ownership. Not regulated under Sarbanes-Oxley Act. No GAAP reconciliation requirement. No end restrictions on funds raised other than imposed under Foreign Exchange Management Act (FEMA). Shareholding under unsponsored ADR will be classified under the FDI cap. Voting rights to be retained by the investors. DRs to be listed on an exchange. Additional sources: IFR India Offshore Financing Roundtable 2014 , Neil Atkinson, BNY Mellon “The Depositary Receipt: Market Review” BNY Mellon, January 2015 CPI probably rose in Jan on base year shift , Reuters February 12, 2015 “Unsponsored ADRs: Evolution and opportunities” – Deutsche Bank Disclosure: The author has no positions in any stocks mentioned, and no plans to initiate any positions within the next 72 hours. (More…) The author wrote this article themselves, and it expresses their own opinions. The author is not receiving compensation for it (other than from Seeking Alpha). The author has no business relationship with any company whose stock is mentioned in this article.