Tag Archives: financial

By The Numbers: ETF Investment And The Indian Market
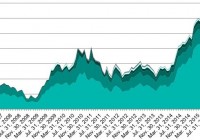
By Utkarsh Agrawal Since the introduction of ETFs, the dynamics of investing has changed dramatically. Apart from being more transparent, with lower costs and improved tax efficiency, ETFs have helped create the opportunity for smaller investors to access asset classes previously available only to institutional investors. Emerging markets tend to be riskier than developed markets, but can also offer diversification opportunities. With emerging market ETFs, it has become possible to incorporate the objectives and constraints of investors who desire exposure to emerging markets in their portfolio construction process. Among emerging markets, India has been one of the preferred countries. The assets under management (AUM) and the number of the ETFs that provide exposure to India have increased tremendously. All of these ETFs are based on Indian equities. As of July 2015, there were 27 of them, with combined AUM of USD 12.80 billion, domiciled across seven countries (see Exhibit 1). The U.S. has been the greatest contributor in terms of both AUM and the number of ETFs, followed by France, Singapore, and other countries. Since August 2015, the combined AUM has decreased by more than USD 2.27 billion, amounting to a decline of almost 18%, and it stood at USD 10.53 billion as of September 2015. This reduction in AUM has also contributed to the volatility of the equity market and the exchange rate in India. Exhibit 1: International Equity ETFs That Provide Exposure to India Source: Morningstar. Data as of Sept. 30, 2015. Chart is provided for illustrative purposes. As opposed to the international Indian ETFs, India’s domestic ETFs are not only limited to equities. They also include commodities, fixed income investments, and money markets (see Exhibit 2). As of September 2015, the total number of domestic ETFs was 51, and the combined total AUM stood at USD 2.09 billion. The proportion of domestic equity ETFs in the combined total AUM was almost 48%, at USD 1.00 billion as of September 2015. The AUM of the domestic equity ETFs in India account for just 10% of that of the international equity ETFs that provide exposure to India. The recent rise in AUM of India’s domestic equity ETFs can be attributed to the introduction of the Central Public Sector Enterprise (CPSE) ETF, as well as the investment by the Employees’ Provident Fund Organization (EPFO). The Central Board of Trustees (CBT), the apex decision-making body of the EPFO, has recently decided to invest in India’s domestic equity ETFs within the prescribed limit of 5%-15% of the total corpus. Exhibit 2: Domestic ETFs in India Source: Morningstar, Association of Mutual Funds in India and Reserve Bank of India. Data as of Sept. 30, 2015. Chart is provided for illustrative purposes. The S&P BSE SENSEX , India’s heavily tracked bellwether index, is designed to measure the performance of the 30 largest, most-liquid, and financially sound companies across key sectors of the Indian economy. As of September 2015, it has served as the underlying index to one international equity ETF, which provides exposure to India, and five domestic Indian equity ETFs. Over the past 10 years, ending in September 2015, the S&P BSE SENSEX has yielded an annualized total return of 13.32% in Indian rupees (see Exhibit 3). Apart from domestic Indian equity ETFs based on other indices, the EPFO will also invest in the domestic S&P BSE SENSEX ETF, leading to expectations of a further boost to the AUM of this established index. Source: S&P Dow Jones Indices. Data as of Sept. 30, 2015. Chart is provided for illustrative purposes. Past performance is no guarantee of future results. Disclosure: © S&P Dow Jones Indices LLC 2015. Indexology® is a trademark of S&P Dow Jones Indices LLC (SPDJI). S&P® is a trademark of Standard & Poor’s Financial Services LLC and Dow Jones® is a trademark of Dow Jones Trademark Holdings LLC, and those marks have been licensed to S&P DJI. This material is reproduced with the prior written consent of S&P DJI. For more information on S&P DJI and to see our full disclaimer, visit www.spdji.com/terms-of-use .

Is Abenomics 2.0 Boosting Japan Mutual Funds?

In late September, Japanese Prime Minister Shinzo Abe had announced the second stage of his popular Abenomics plan. The “stage two” plan is aimed to resuscitate the Japanese economy. Among other things, the goal is to boost Japan’s gross domestic product by a significant 20% to $5 trillion by 2020. Following this, Japan Stock mutual funds have gained relatively well. In October, the sector gained 7.9% and in November Japan stock funds added 1.3%, which helped it to finish among the top gainers for the month. Morningstar data also shows that Japan Stock funds are leading one-month gains currently. Abe unveiled a new set of economic initiatives, which he dubbed as “Abenomics 2.0.” He promised to take Japan into a new era of prosperity. His proposals have, however, been met with both bouquets and brickbats. Some economists and market watchers have questioned the viability of the proposals. For instance, executives from leading business lobby termed Abe’s numerical targets as “outrageous” and “impossible.” During the first phase of Abenomics, Japan’s benchmark, Nikkei 225, had shown a significant uptrend. Though it is too early to predict whether the new targets are already having a positive impact, Nikkei 225 has gained 4.5% since Sept. 29. The focus once again shifts to Japan mutual funds, which were topping the charts earlier this year before stumbling in the third quarter. Japan’s economic situation is not as fragile as is widely believed. So, it’s not a bad idea to pick Japan mutual funds which are poised to benefit under existing conditions and will gain further as the economy continues to gather steam. Abenomics 2.0: The Three Arrows Abe outlined several new policy measures late last month, which he calls “Abenomics 2.0.” Abe spoke of new targets or his new “three arrows”: achieving a higher GDP over the next five years, providing support for child care and better social security. The last two are aimed at improving child rearing and care for the elderly for economically distressed families. Abe also aims to boost social security by offering care to the nearly 150,000 people who are slated to enter nursing homes. He also said that he would increase employment opportunities for the retired. Several prominent newspapers and economists have questioned where Abe will find the resources to fuel the last two initiatives. Has There Been A Positive Trend? Market watchers and economists have also pointed to the fact that several of Abe’s initial targets are still unfulfilled. Others question the efficacy of the first phase of Abenomics and have argued that only the monetary policy has proven to be effective. However, an assessment of the state of Japan’s economy by the Financial Times tells us a different story. The study has praised Abenomics’ record on improving corporate governance standards. The objective of these changes has been to increase return on equity and raise the number of independent directors. The ability to push through reforms in the agricultural sector has also been praised. Japan’s unemployment rate of 3.3% is much lower than several developed economies. Real monthly wages recorded their first yearly increase in July in more than two years. Additionally, the average wage increase for fiscal 2015 is 2.2%, the highest level achieved in 17 years. Japan Mutual Funds Japan Stock fund category had emerged as the best gainer in the first half of 2015. The market rout since then has dragged down major categories. However, Japan funds were less affected than its neighboring regions. Japan funds are up nearly 14% year to date, according to Morningstar. This is the best year-to-date gain so far among all fund categories. Banking on the optimism, investors interested in investing in Japan region may bet on the following three mutual funds. These funds carry either a carry a favorable Zacks Mutual Fund Ranks. The following funds carry either a Zacks Mutual Fund Rank #1 (Strong Buy) or Zacks Mutual Fund Rank #2 (Buy) as we expect the funds to outperform their peers in the future. Remember, the goal of the Zacks Mutual Fund Rank is to guide investors to identify potential winners and losers. Unlike most of the fund-rating systems, the Zacks Mutual Fund Rank is not just focused on past performance. The minimum initial investment is within $5,000. These funds are in the green over year to date and one-year periods. The three- and five-year annualized returns are also favorable. Fidelity Japan Smaller Companies Fund No Load (MUTF: FJSCX ) seeks capital appreciation over the long term. It invests most of its assets in Japanese securities or other instruments economically connected with Japan. FJSCX invests in securities of companies with market cap similar to those listed in Russell/Nomura Mid-Small Cap Index or the Japanese Association of Securities Dealers Automated Quotations (JASDAQ) Index. Fidelity Japan Smaller Companies currently carries a Zacks Mutual Fund Rank #1. FJSCX has gained 13.7% and 13.5% over year-to-date and one-year periods, respectively. The three- and five-year annualized returns are respectively 18.7% and 12%. Annual expense ratio of 1% is lower than the category average of 1.43%. T. Rowe Price Japan Fund No Load (MUTF: PRJPX ) invests a lion’s share of its assets in companies located in Japan. The fund invests in companies of all sizes and across Japanese industries. Managers use a bottom-up stock selection process while also being aware of industry outlooks. T. Rowe Price Japan currently carries a Zacks Mutual Fund Rank #1. PRJPX has gained 16% and 11.7% over year-to-date and one-year periods, respectively. The 3- and 5-year annualized returns are respectively 12.7% and 7.8%. Annual expense ratio of 1.05% is lower than the category average of 1.43%. Rydex Japan 2x Strategy Fund A (MUTF: RYJSX ) seeks to give returns that correspond to two times the performance of the fair value of the Nikkei 225 Stock Average. RYJSX invests in common stocks having market capital within the range of those listed in the index. RYJSX invests a lion’s share of its assets in securities that have the potential to return two times the performance of the underlying index. Rydex Japan 2x Strategy Fund Class A currently carries a Zacks Mutual Fund Rank #2. RYJSX has gained 20.3% and 11.8% over year-to-date and one-year periods, respectively. The three- and five-year annualized returns are respectively 20% and 6.8%. Annual expense ratio of 1.54% is lower than the category average of 2.03%. Original post

3 Dividend ETFs With Yields Over 3% And 1 Coming Respectably Close

Summary These four dividend ETFs have similar expense ratios but substantially different holdings. DVY looks like the ETF with the highest chance to go on sale in December if the Fed Funds rate is increased. DVY and DTN have zero exposure to real estate which may be favorable for investors concerned about income taxes on REITs. One of the areas I frequently cover is ETFs. I’ve been a large proponent of investors holding the core of their portfolio in high quality ETFs with very low expense ratios. The same argument can be made for passive mutual funds with very low expense ratios, though there are fewer of those. In this argument I’m doing a quick comparison of several of the ETFs I have covered and explaining what I like and don’t like about each in the current environment. The Four ETFs Ticker Name Index QDF FlexShares Quality Dividend Index ETF Northern Trust Quality Dividend Index DHS WisdomTree Equity Income ETF WisdomTree High Dividend Index DTN WisdomTree Dividend ex-Financials ETF WisdomTree Dividend ex-Financials Index DVY iShares Select Dividend ETF Dow Jones U.S. Select Dividend Index By covering several of these ETFs in the same article I hope to provide some clarity on the relative attractiveness of the ETFs. One reason investors may struggle to reconcile positions is that investments must be compared on a relative basis and the market is constantly changing which will increase and decrease the relative attractiveness. For investors that want to see precisely which assets I’m holding, I opened my portfolio near the end of November. Dividend Yields I charted the dividend yields from Yahoo Finance for each portfolio. The FlexShares Quality Dividend Index ETF is the weakest of the batch on dividend yields, but I wouldn’t consider 2.78% even remotely bad. That is a very respectable dividend yield for an equity portfolio that is not focused on carrying REITs, BDCs, or other very high yield investments. The two WisdomTree funds both come in with very high dividend yields. (click to enlarge) Expense Ratios These funds are all extremely similar on expense ratios. (click to enlarge) Sector Even if an investor was going to focus on dividend yields, there are three funds with yields that are materially above 3%. The expense ratios are also very similar which reinforces that investors need to be looking at the sector allocations to make the determination of which ETF makes the most sense for them. I built a fairly nice table for comparing the sector allocations across dividend ETFs to make it substantially easier to get a quick feel for the risk factors: (click to enlarge) First Glance I imagine most readers looking at that glance first noticed the exceptionally tall purple bar representing the utility allocation for DVY. This is a dividend growth fund that has a fairly huge allocation to the utility sector. DVY DVY uses a very heavy allocation to utilities. For investors that already build their own utility positions in their portfolio, this wouldn’t be a great fit since it would double up on the exposure. On the other hand, for the investor that does not have utility exposure in their portfolio, the ETF could be a great fit. The utility sector often demonstrates some correlation with bonds because investors treat it as an alternative source of income. This may be a fairly volatile sector going into December because investors are expecting the Federal Reserve to raise rates and if a rate increase is confirmed it could send bond yields higher and utility stocks would be expected to fall at the same time so that the dividend yields would increase. I won’t be surprised if the Federal Reserve raises rates in December, but if they manage to raise rates 5 more times within the next year and a half I would be quite surprised. I don’t expect great results on the increase in rates, so I don’t think the following years will see further increases. I wouldn’t be surprised if see the Federal Reserve’s short term rate fall back to 0% before it makes it up to 1%. DTN and DVY In addition to being heavy on utilities, DVY joins DTN in having no allocation to real estate. I don’t mind the exclusion of real estate since I expect many investors may want to use this kind of dividend growth ETF in a taxable account while pushing their REIT exposure into a tax exempt account. For an investor putting a large part of their portfolio in either of these ETFs, it would be reasonable to look for some exposure to REITs somewhere else in the portfolio. I’m using equity ETFs for around 20% to 25% of my portfolio and I may look to increase that in December and going into next year if the REITs are on sale following an increase in the Fed Funds rate. DTN also has virtually no exposure to the financial services sector. Since their name includes “ex-Financials”, I think that makes a great deal of sense. DTN would fit best in a portfolio where the investor was manually choosing their own bank stocks and REITs for the portfolio. QDF QDF offers the lowest dividend yield and when I look at the sector allocations it appears fairly aggressive for a dividend portfolio. The allocation to utilities and consumer defensive are both fairly low and in both cases QDF has the lowest allocation in the portfolio. In my opinion, the best scenario for QDF relative to the other ETFs would be a longer bull market where more aggressive allocations would be rewarded. Compared to an actual aggressive allocation, this would be fairly tame but when compared to other high yield portfolios it is less defensive. What do You Think? Which dividend ETF makes the most sense for you? Do you use DVY to get your utility allocation, or do you pick your own utilities (or use a different ETF)? Is the dividend yield on DVY or DTN enough to bring you into the ETF? The only major weakness I see for this batch of ETFs is that the expense ratios are higher than I would like to see. However, when choosing between these four ETFs the ratios are very comparable.