Tag Archives: feeds

Damage Control: Is It Too Late Too Become More Defensive?

A manufacturing recession doesn’t matter… until it does. Consider industrial production. For the third straight month, industrial production, which includes mining, utilities, as well as manufacturing, contracted. How anemic is American industry right now? The year-over-year percentage change provides a helpful snapshot of the weakness. Not surprisingly, media mega-stars routinely dismiss manufacturers, miners and utility providers as relics of yesterday’s economy. They maintain that consumers are the only ones who count in a consumption-based society. The erosion of the high-paying careers in those segments notwithstanding, might the rosy projections for household consumption be misleading? After all, retail sales (ex auto) pulled back 0.1% in December, even as economists anticipated 0.2% growth. We can look at consumer trends in a variety of ways. As I pointed out in my most recent commentary (1/12/16), year-over-year percent growth in personal consumption expenditures (PCE) has been declining steadily for roughly 18 months. Meanwhile, year-over-year percentage changes in retail sales (ex auto) emulate what is taking place in American industry. So what happened to the “clear-cut” benefit of lower oil prices? Weren’t they supposed to be a giant tax cut for the American consumer, prompting them to spend? Not when wage growth is tepid. And not when many households have chosen to increase their savings. It should not go unnoticed that the S&P SPDR Retail Index has quickly descended into bear territory. The SPDR S&P Retail ETF (NYSEARCA: XRT ) is currently down about 22.3%. Even more disheartening for those who had not become more defensive in their asset allocation over the past year? The price of XRT is lower than it was two years ago. Ironically enough, the question is no longer whether U.S. stocks have entered a bear market in the same way that the retail segment has. Indeed, Bespoke Research already demonstrated that the average large-company stock, the average mid-sized company stock and the average small-company stock have all surpassed the 20% bear market threshold. In the same vein, the median stock in the Russell 3000 and the Value Line Index show the same. The only question now is whether or not there will be enough buying interest in market-cap weighted indices like the S&P 500 and the Dow Jones Industrials to avoid a similar fate. The SPDR S&P 500 Trust ETF (NYSEARCA: SPY ) does have impressive support at the 185 level. In my estimation, the best shot that the major benchmarks have in avoiding a “bear market headline” is the same injection that occurred during the euro-zone crisis in 2011. Specifically, nearly all of the U.S. indexes and overseas benchmarks fell 20%-40% during that summer. The Dow and the S&P 500 escaped a similar fate with depreciation of “just” 19%-19.9%, due to “well-timed” stimulus promises by the European Central Bank (ECB) and the U.S. Federal Reserve. Already, Fed fund futures have pushed out their anticipation of a second rate hike out to Q3 (July-September) from March. The market does not believe the Fed party line of 4 rate hikes in 2015. In fact, if the Dow and the S&P 500 do fall to significantly lower levels, one might anticipate the central bank of the United States reversing course; perhaps the notion of negative interest rates and/or QE4 might be introduced to the investing public. Historically speaking, however, the wildcard of a Fed reversal may not be enough to calm the nerves of panicky market-based participants. Take a look at this table for the S&P 500’s first five trading days in January. (Note: I won’t even incorporate the horrific second week that investors are dealing with right now.) The worst first five days for the S&P 500 occurred right here in 2016. But that’s not all. In the table, seven of the nine worst starts ultimately offered poor risk-reward results, either with additional losses or sub-par total gains through year-end. “Wait a second, Gary. Those other two years in 1991 and in 1982 show extraordinary price appreciation. Isn’t that reason enough to be optimistic?” Not if you recognize that the price gains that occurred in 1991 came at the conclusion of the 20% losses for the 1990-1991 stock market bear. And not if you realize that the price appreciation that followed in 1982 came at the end of the 27% losses for the 1981-1982 stock market bear. Right now, we’re not coming off of a 20% price collapse of the S&P 500. It follows that to the extent one wants to take the history of market direction into account, one would have to look at 2016’s prospects in an unfavorable light. I spent the better part of 2014 explaining the benefits of a barbell approach for a late-stage bull . We matched large-cap U.S. stock assets like the iShares Core S&P 500 ETF (NYSEARCA: IVV ), the Health Care Select Sect SPDR ETF (NYSEARCA: XLV ) and the iShares S&P 100 ETF (NYSEARCA: OEF ) with longer-term investment grade bonds like the Vanguard Extended Duration Treasury ETF (NYSEARCA: EDV ), the iShares 7-10 Year Treasury Bond ETF (NYSEARCA: IEF ) and the SPDR Nuveen Barclays Municipal Bond ETF (NYSEARCA: TFI ). By May of 2015, I expressed the tactical asset allocation changes that I believed were necessary in an unfavorable risk-reward environment, encouraging investors to lower their overall exposure to risk assets . Trying to exit markets during panicky sell-offs rarely proves beneficial. That said, if you believe that you may have been too assertive with your exposure to riskier holdings, you might wait for an inevitable bounce higher. One can work his/her way to a more defensive stance until the fundamental, technical and economic backdrop improves. Disclosure: Gary Gordon, MS, CFP is the president of Pacific Park Financial, Inc., a Registered Investment Adviser with the SEC. Gary Gordon, Pacific Park Financial, Inc, and/or its clients may hold positions in the ETFs, mutual funds, and/or any investment asset mentioned above. The commentary does not constitute individualized investment advice. The opinions offered herein are not personalized recommendations to buy, sell or hold securities. At times, issuers of exchange-traded products compensate Pacific Park Financial, Inc. or its subsidiaries for advertising at the ETF Expert web site. ETF Expert content is created independently of any advertising relationships.
What Determines A Stock’s Value?

The biggest question in investing is whether the stock market-or a sector, industry, or specific stock-is going to go up or down in the months ahead. “I don’t blame anyone for asking that question,” says Brad Sorensen, Director of Market and Sector Analysis at the Schwab Center for Financial Research. “It’s the one we all want answered.” Of course, no one knows for sure which direction the stock market will go-especially in the short term. That’s because a wide number of variables, many of which can’t be predicted, can make the markets move in one direction or the other and render useless even the best research and analysis. These variables can include regulatory changes, extreme weather or natural disasters, changes in management-the list goes on. That doesn’t mean investors can’t make intelligent, informed guesses . While no one can predict the market’s exact ups and downs, investors have the potential to boost their investment returns over the long term if they can identify sectors or stocks that are undervalued or overvalued. Valuing the Market At any given point in time, the stock market’s value is the sum of all of the shares outstanding multiplied by their prices. If we all agreed that this value was fair, then stock prices would be static, stuck in place until an outside variable-say, the release of new economic data-changed investors’ minds. But the reality is that we don’t all agree, and that’s why there are so many ways to value the market. One is to compute the value of the entire stock market (total market capitalization) relative to U.S. gross national product. Another way is the Q ratio. It starts with total market capitalization and divides that number by the replacement cost, or the amount of money a company would have to spend to replace an asset, added up across all companies and industries. A third method, used by Morningstar, calculates fair value assumptions using a proprietary discounted cash flow model. The model assumes that each stock’s value is equal to the total of the free cash flows the company is expected to generate in the future, discounted back to the present. Tallied up, these individual valuations help determine whether the market as a whole is over- or undervalued. Evaluating Individual Stocks Many investors look at common, well-known metrics to determine how a stock is likely to perform. One of investors’ most widely used tools in this respect is the price-to-earnings (P/E) ratio-the measure of a stock price compared to its per-share earnings. “The P/E ratio is a familiar metric for many investors, as there tends to be a lot of information out there about earnings,” Brad says. “But it’s far from being a perfect measure, and it’s only one piece of the puzzle.” For example, many P/E ratios are retroactive measures-meaning they reflect a current price against a trailing 12-month profit. That’s useful, but investors generally aren’t buying a company’s past. Instead, they are investing in the future, trying to capture growth. Price-to-book (P/B) ratio is another popular tool for measuring the price of a stock or index against its per-share book value (total assets minus intangible assets and liabilities). A low P/B ratio-typically less than 1-could indicate that a stock is undervalued. This metric is popular among value investors, who search for securities that trade below their intrinsic net worth. But, like P/E ratios, P/B ratios have their limitations. For instance, a P/B ratio tends to be more useful for companies with a lot of hard assets on their books, such as factories or equipment. The ratio says less about companies with significant non-physical assets, such as intellectual property and brands. Brad says that it’s not wrong for investors to consider P/E or P/B ratios as part of their research, but that they shouldn’t rely on this data alone. There are plenty of metrics-such as cash flow and debt ratios-that an investor can use to measure value. Brad also recommends that investors pay close attention to sales growth-especially in today’s market. “Many companies stayed afloat during the recent market downturn by cutting costs everywhere they could,” Brad says. “Going forward, companies will have to rely on sales growth in order to maintain viability and profitability.” Analyzing Sectors For sector analysis-the area that Brad focuses on-determining trends means incorporating macro-economic data points and other factors that might impact a particular industry. When analyzing the technology sector, for example, Brad and his team track the age of current equipment and whether companies have the cash to invest in new technology. They also examine whether the environment is favorable for financing purchases. Some sectors-such as financials, which include banks, investment firms, mortgage companies, and insurers-are more complicated than others to analyze. “These businesses are vulnerable to regulatory and interest rate changes, and even natural disasters,” Brad says. “There are hundreds of data points to consider.” Historical Insights While it’s important to look ahead in an attempt to gain insight into where a company or sector is heading, Brad suggests investors pay attention to historical valuation levels. “It’s critical to look at investments relative to how they have traded and performed at different points during economic cycles,” he says. “An investment’s past performance doesn’t guarantee its future returns, but historical data can provide clues as to what might happen.” As a result, Brad and his team constantly update valuation models and forecasts based on incoming economic data, and-at least monthly-look back in time to see if a stock or sector is trading in a pattern that could help inform future movement. “It’s a juggling act-looking back and evaluating possible future scenarios simultaneously, and taking in as much information as possible to help make informed decisions down the road,” he says. Making Sense of the Data With so many different data points to consider, some investors might find it difficult to track down and synthesize information about a specific investment or a particular area of the market. Brad Sorensen and his colleagues at the Schwab Center for Financial Research spend much of their time evaluating and rating stocks and sectors in order to provide Schwab clients with objective, comprehensive research to help them make informed decisions. One result of their efforts is the collection of approximately 3,000 Schwab Equity Ratings® . Available to Schwab clients, these A-F grades can help condense and simplify large amounts of data based on a 12-month outlook. Conclusion Though no one can consistently and accurately predict what the market does next, knowing how stocks are valued can help you find opportunities. By identifying sectors or stocks that are undervalued or overvalued, you may be able to boost investment returns over the long term. Important Disclosures The information here is for general informational purposes only and should not be considered an individualized recommendation or personalized investment advice. The investment strategies mentioned here may not be suitable for everyone. Each investor needs to review an investment strategy for his or her own particular situation before making any investment decision. Investing involves risk, including loss of principal. Sector investing may involve a greater degree of risk than an investment with broader diversification. Schwab Equity Ratings use a scale of A, B, C, D and F, and are assigned to approximately 3,200 U.S.-traded stocks headquartered in the United States and certain foreign nations where companies typically locate or incorporate for operational or tax reasons. Schwab’s research outlook is that A-rated stocks, on average, will strongly outperform, and F-rated stocks, on average, will strongly underperform the equities market during the next 12 months. Schwab Equity Ratings are not personal recommendations for any particular investor. Before buying, investors should consider whether the investment is suitable for themselves and their portfolio. Schwab Equity Ratings should only constitute one component in your own research to evaluate stocks and investment opportunities. From time to time, Schwab may update the Schwab Equity Ratings methodology. Schwab Equity Ratings and the general buy/hold/sell guidance are not personal recommendations for any particular investor or client and do not take into account the financial, investment or other objectives or needs of, and may not be suitable for, any particular investor or client. Investors and clients should consider Schwab Equity Ratings as only a single factor in making their investment decision while taking into account the current market environment. Schwab Industry Ratings provide Schwab’s outlook for industries based on Global Industry Classification Standard (GICS®) groupings, such as Beverages, Pharmaceuticals and Software. Schwab Industry Ratings are assigned using an A, B, C, D and F rating scale and can be particularly helpful in evaluating which industries investors may want to emphasize within a specific sector. They can also be used in conjunction with Schwab Equity Ratings to help fill in gaps in a portfolio. See Schwab.com for more information. The Schwab Center for Financial Research is a division of Charles Schwab & Co., Inc. Morningstar, Inc., is not affiliated with Charles Schwab & Co., Inc. ©2015 Charles Schwab & Co., Inc. ( Member SIPC ) All rights reserved. (0214-0042)

The Sources Of Volatility And The Challenge For Active Management

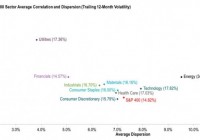
By Craig Lazzara, Global Head of Index Investment Strategy If we needed a reminder of the continuing volatility of the world’s financial markets, the first weeks of 2016 obliged us by providing one. What’s often overlooked, especially when volatility spikes, is that there are two distinct sources of volatility . Understanding them can not only enhance our appreciation of market dynamics, but also provides some important insights for portfolio managers. The two components are correlation and dispersion . Correlation, the more familiar of the two, is a measure of timing . Correlations within an equity market are, in our experience, invariably positive , indicating that stocks tend to move up and down together. As correlations rise and diversification effects diminish, the co-movement of index components is heightened, and market volatility increases. Dispersion, on the other hand, is a measure of magnitude : it tells us by how much the return of the average stock differs from the market average. In a high dispersion environment, the gap between the market’s winners and losers is relatively large. Given positive correlations, as dispersion rises, the market’s gyrations will take place within wider bands – and volatility will increase. The chart below illustrates the cross-sectional interaction of dispersion, correlation, and volatility using the sectors of the S&P 400 . The numbers in parentheses show the last 12 months’ volatility for each sector. Energy, unsurprisingly, was the most volatile sector, driven largely by its very wide dispersion. The Financials sector was the index’s least volatile. Notice that the volatility of Utilities (17.4%) and Health Care (17.0%) were more or less the same. Yet their volatility came from different sources . Utility volatility is correlation-driven; the gap between the sector’s winners and losers is low, producing low dispersion, but the winners and losers are highly likely to move together, producing high correlation. Health Care’s volatility comes from the opposite direction – from low correlation, meaning that the sector’s components tend to move more independently, but with higher dispersion, indicating a bigger gap between winners and losers. The sources of sector volatility have important implications for active managers: For a sector like Utilities, stock selection should be a relatively low priority. Low dispersion means that the gap between winners and losers is relatively low; this reduces the value of an analyst’s skill . For Health Care (and other high-dispersion sectors), the situation is different – the opportunity to add (or to lose) value by stock selection is relatively large. If research resources are constrained, this is where they should be concentrated. The nature of the research question is fundamentally different for these two sector types. For Utilities, the sector call is important, the stock selection decision much less so. For Health Care, the stock selection decision is more critical. An investor who understands the sources of volatility is more likely to be successful at managing and exploiting it. Disclosure: © S&P Dow Jones Indices LLC 2015. Indexology® is a trademark of S&P Dow Jones Indices LLC (SPDJI). S&P® is a trademark of Standard & Poor’s Financial Services LLC and Dow Jones® is a trademark of Dow Jones Trademark Holdings LLC, and those marks have been licensed to S&P DJI. This material is reproduced with the prior written consent of S&P DJI. For more information on S&P DJI and to see our full disclaimer, visit www.spdji.com/terms-of-use .