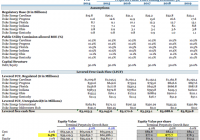
Summary Duke Energy is a high quality large cap regulated utility. Duke Energy’s cost of equity, estimated to be 6.50%, does not properly compensate its shareholders. Duke Energy’s risk-reward is not attractive from the long-perspective. Executive Summary: Duke Energy (NYSE: DUK ) is a high-quality large-cap regulated utility , headquartered in North Carolina, with international assets located in Latin America. However, Duke Energy’s cost of equity at 6.5% is cheaper than the cost of preferred shares at 7.1% and is marginally more expensive than its cost of debt at 5.1%. Therefore, Duke Energy does not properly compensate its shareholders and Duke Energy’s risk-reward is not attractive from the long perspective. Duke Energy Short Thesis: Duke Energy is a regulated electric utility . The company, to a lesser extent, is a merchant power provider. The company is engaged in the generation, transmission, and distribution of electricity. The company’s energy generation portfolio consists of a wide variety of sources such as nuclear, coal, natural gas, solar, wind and hydroelectric. The company’s geographic footprint includes the Carolinas, Indiana, Florida, Ohio and Kentucky. The company also has non-core unregulated assets in Latin America, primarily located in Brazil, that accounted for ~13.0% of the company’s FYE 2014 sales. The company also has a small joint venture located in Saudi Arabia. However, Duke Energy’s risk-reward profile is not attractive from the long perspective. Currently, the company’s cost of equity of 6.5% does not properly compensate the company’s shareholders. Duke Energy’s preferred shares, which are higher on the company’s capital structure, yield 7.1%. Furthermore, Duke Energy’s shareholders currently faces an inordinate amount of risk given the penetration of distributed generation, also known as residential rooftop solar, the deterioration of Duke Energy’s international assets and the mismanagement of Duke Energy’s coal ash spill. Firstly, Duke Energy’s cost of equity of 6.5% does not properly compensate Duke Energy’s shareholders. Duke Energy’s implied cost of equity capital could be easily backed into given that Duke Energy is a regulated utility with earnings “fixed” by its regulators. Duke Energy’s regulatory rate base is $51.0 billion, broken down into $19.8 billion in Duke Energy Carolinas, $11.6 billion in Duke Energy Progress, $8.7 billion in Duke Energy Florida, $7.3 billion in Duke Energy Indiana, $2.3 billion in Duke Energy Ohio, and $0.8 billion in Duke Energy Kentucky. Duke Energy’s projected increases to its regulatory rate base are provided on Duke’s earnings call presentation and provided below. The Public Utility Commission allowed ROE, on Duke’s regulatory rate base, is 10.2% for Duke Energy Carolinas and Duke Energy Progress, 10.5% for Duke Energy Florida and Indiana, 11.1% for Duke Energy Ohio and 10.4% for Duke Energy Kentucky. Normalizing Duke Energy’s capital structure at 50% debt to equity (currently 47.1% debt to 52.9% equity) and normalizing Duke Energy’s international earnings to 10% of the company’s earnings, Duke Energy’s implied cost of equity is 6.5% with shares at $77.70. Sensitivity analysis would suggest that Duke Energy’s cost of equity is between 6.0% and 7.0% with a high degree of confidence. (click to enlarge) Source: Author Duke Energy’s current return on equity of 6.5% is extremely difficult to justify given that Duke Energy’s bonds yield a similar percentage point and given that Duke Energy’s equity is considerably riskier than its debt. Duke Energy’s junior subordinated debentures issued in 2013 due in 2073 currently yield 5.125% (see, below). Duke Energy’s junior subordinated debt is rated BBB- by Fitch. (click to enlarge) Source: Duke Energy Duke Energy’s current return on equity of 6.5% is extremely difficult to justify given that Duke Energy’s preferred shares, now called, yield a higher percentage point and given that Duke Energy’s equity is considerably riskier than its preferred shares. Duke Energy’s (Florida Progress) preferred shares, recently called, yielded 7.10%. (click to enlarge) Source: Duke Energy Prospectus Simply put, Duke Energy’s cost of equity or return on equity from the shareholders perspective at 6.5% is too little to wet the beak of investors. Duke Energy’s junior debt and preferred shares yield 5.125% and 7.100% respectively. Therefore, Duke Energy’s cost of equity should, at a minimum, be greater than 7.100%. Currently, Duke’s most subordinated debt is rated BBB- by Fitch. Therefore, Duke Energy’s return on its equity, which is subject higher risk than Duke Energy’s debt should Duke Energy experience financial turbulence, should be on par with the return on more subordinated debt, such as the CCC rated bonds, which are currently yielding 10.53% (see, below). (click to enlarge) Source: WSJ Market Data Center Duke Energy’s return on equity is too low. Should Duke Energy’s cost of equity become equivalent to the yield of its previously issued preferred shares, Duke Energy’s shares would be worth, at a maximum, $72.0 (6.0% upside from current prices at $76.0). Should Duke Energy’s cost of equity become equivalent to that of CCC-rated debt, Duke Energy’s shares would be worth $49.0 (38% upside from current prices at $76.0). The likely scenario would be that Duke Energy’s cost of equity would fall somewhere in between the yield of its preferred shares and the yield of a CCC-rated debt, which would suggest that Duke’s shares are worth between $55 to $62 (~25% upside from current prices at $76.0). Calculations are provided below. (click to enlarge) Source: Author Secondly, Duke Energy will struggle to deliver its meager 6.5% ROE as a distributed generation, also known as residential solar, eats into Duke Energy’s revenues and earnings. Currently Duke Energy charges 10.979 cents per KWh for the first 1,000 KWh of electricity delivered, broken down into a 6.656 cents energy charge and 4.323 cents fuel charge, and charges 13.341 cents per KWh for every KWh above 1,000 KWh, broken down into a 8.018 cents energy charge and 5.323 cents fuel charge. (click to enlarge) Source: Duke Energy Residential rooftop solar companies can deliver energy at increasingly competitive price points. SolarCity can deliver electricity at 15.000 cents per KWh (versus Duke Energy at 10.979 cents to 13.341 cents per KWh). Duke Energy’s price per KWh will increase, while SolarCity’s price per KWh will decrease. As Duke Energy increases its regulatory rate base, which includes investments in generation, transmission, and distribution infrastructure, the Company will recover these costs by increasing its price per KWh. On the other side of the coin, as solar technology becomes more efficient, solar companies will be able to decrease the price per KWh. According to GTM , the levelized cost of solar has decreased by 78% over the past 5 years and is expected to further decline. Please note that SolarCity was utilized for pricing purposes only as PPA/leases are not allowed in the state of North Carolina. (click to enlarge) Source: SolarCity Thirdly, Duke Energy will struggle to deliver its meager 6.5% ROE as the Company’s international operations further deteriorate . The company’s international assets, primarily located in Brazil, has suffered from FX exchange rate losses as the Brazilian real slumped against the US dollar. Furthermore, Duke Energy’s assets in Brazil primarily consist of hydroelectric plants. Due to a prolonged drought, thermal generation, such as coal and nuclear plants, are put ahead of hydrogen plants. This means that Duke Energy cannot run its hydroelectric plants and sell electricity until thermal plants are at full generation capacity. Furthermore, due to Brazil’s electricity conservation efforts, the growth of the demand of electricity slowed from a growth rate of 3.0% a year to a growth rate of 0.0% to 2.0% a year. Furthermore, the price of electricity has slumped in Brazil from 823 Brazilian reals per MWh to 388 Brazilian reals per MWh. Fourthly, Duke Energy will struggle to deliver its meager 6.5% ROE as the Company, which violated the Clean Water Act, faces large litigation issues. On 02/14/2014, one of the company’s water main failed , which resulted in a large coal ash spill into the Dan River. This accident resulted in $102.2 million of restitution costs. Furthermore, the company could be on the hook for an additional $25.1 million in restitution costs for its involvement in the groundwater contamination in Wilmington, NC. In Closing, Duke Energy presents an excellent short opportunity. The risk/reward from the long perspective is not compelling. The company’s return on equity is 6.5%, which is less than the return on the company’s preferred shares. The company faces an inordinate amount of risk, given the company’s potential risk with distributed generation, potential risk with the further deterioration of the company’s international assets, and potential risk with further litigation of the company’s coal-ash spills. Disclosure: The author has no positions in any stocks mentioned, and no plans to initiate any positions within the next 72 hours. (More…) The author wrote this article themselves, and it expresses their own opinions. The author is not receiving compensation for it (other than from Seeking Alpha). The author has no business relationship with any company whose stock is mentioned in this article.

