GLD: And So It Begins
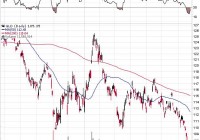
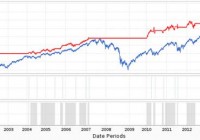
Summary I would imagine that early next week we will see some bargain hunting in the gold shares and the precious metal, as they are very oversold right now. With GLD in freefall, of course we have a plethora of negative news stories on gold hitting the wires. My forecast remains that we are in the topping process for the general market, and gold will be bottoming during all of this. Debasement risk is still very much present, it’s just not at the forefront of the conversation because interest rates are currently low. When prices of assets reach certain levels, the smart money always starts buying. Over the last 6-7 trading days, the SPDR Gold Trust ETF (NYSEARCA: GLD ) has plunged to the 105 region, which means capitulation has begun. As I keep reiterating, and have been for many months now, when GLD hits 90-100, that’s when I will be buying. But I’m not looking to jump into GLD, rather I’m going to be purchasing the beaten down gold (and silver) stocks. I’m simply using GLD as a price guide for when to start getting in. (Source: StockCharts.com) It’s been a rough week for the gold bulls, but I believe we are only 1/3 (maybe 1/2) of the way through this capitulation event. We still could have a ways to go before the bottom. However, this move has been very aggressive, particularly in the gold stock indexes such as the HUI. As I said earlier in the week in the comment section of my last article : I have been following the gold stock sector for over 12 years now, and that was one of the ugliest days in the HUI I can recall in a long-time. You have to go back to 2008 financial crisis to see that kind of percent loss in one day. At this rate, the HUI will reach 70 in a 1-2 weeks. Given I was expecting the bottom to take 2-4 months, this seems too much too soon. Might have a little follow through tomorrow but I think there is a good chance the HUI rebounds back above 120 by the end of the week. I’m not forecasting any major bounces (could reach 130 but not much more). Rather I think we see some consolidation for a few weeks before the next drop. We shall see. It’s hard to call short term moves like this. Either way, stay on the sidelines. It’s way to volatile now, just wait for the bottom. The HUI wasn’t able to rebound back above 120 today (Friday), but it along with GLD did make an intraday reversal. I would imagine that early next week we will see some bargain hunting in the gold shares and the precious metal. We are way oversold in both and need to consolidate a little here before we go down again. I still don’t expect any major rebounds. This is capitulation, you just normally don’t see strong moves to the upside when you are in the middle of it like we are now. I would be very surprised if GLD went back up to the 110 level. Rather, I believe we will see a modest bounce in the ETF and the HUI. A 2-3 week period of consolidation would be perfectly normal (and expected). I will say that during this period, several gold stocks could pop 10-20%. If that doesn’t occur, and GLD and the HUI continue to plunge, then my 2-4 month forecast before we hit the final bottom will be a little off. It simply might happen in a shorter period of time. But the time-frame isn’t important, all that matters is the price level. When GLD gets in that 90-100 region, and the gold stocks are dead and buried, I will be buying. It doesn’t matter if that is 1 month from now or 4 months. But I don’t have a crystal ball (it sure would make things easy if I did). If I’m wrong, and GLD and the gold stocks have officially bottomed, then I will have to re-evaluate. I have been mostly on the sidelines for several months, and at this point I plan to remain there until we either go down to my buy in target or we break above key levels. If I see GLD get above resistance – and show a major reversal – then I will start buying gold stocks. I have been telling readers since last November that I always use key levels to determine whether to buy in/sell out. I don’t want to be in gold stocks if major support levels in GLD are broken to the downside, and I don’t want to be on the sidelines if GLD breaks above major resistance. I must admit, given the recent sell-off in the gold and silver stocks, that little voice in the back of my head says “don’t get too greedy, things are already extremely cheap.” For now though, GLD and the gold stocks are showing no strength, and until that changes, I will remain in cash. The Most Accurate Gold Forecaster During 2013 Predicts $800 Gold With GLD in freefall, of course, we have a plethora of negative news stories on gold hitting the wires. Anybody who has been extremely bearish on the precious metal is getting a lot of press. Georgette Boele is Coordinator of Currency and Precious Metals Strategy at ABN AMRO Group Economics. She was named the “most accurate forecaster of the gold price during 2013 by Metal Bulletin Apex, which aggregates and analyses the accuracy of metals prices forecasts and research produced by banks and other industry participants.” Earlier this week, she put out her latest publication on the precious metals market, and this is what she had to say: Moreover, the adjustment in expectations that the Fed will start hiking this year have made precious metals that yield zero to almost nothing very unattractive … Investors will likely liquidate gold positions when US dollar and US rates go up in an environment where inflation expectations remain muted and investor sentiment is constructive. Moreover, as gold has a relatively low share of industrial demand, this will unlikely come to the rescue when industrial demand picks up. Although, we expect Chinese gold demand, especially jewellery demand, to improve, this should not be able to offset the negative trend in gold. A few days before that publication came out, here were Ms. Boele’s price targets for gold (as of July 20th). She’s was expecting $1,000 by the end of 2015, and $800 by the end of 2016. Those price targets haven’t changed in her latest update, but can you spot the odd forecast below? An increasing silver price as gold crashes? In fairness, she did just slightly lower her year-end target (2016) for silver to $17, but still. Gold and silver follow each other, so I just don’t see these two trading inverse with one another over the next year or so. Especially not because of increased industrial demand for silver. (Source: ABN AMRO) Take a look at her forecast in 2013 for silver and you will see what I’m talking about. Even back then, she was predicting a rising silver price but a plunging gold price. That turned out to be inaccurate, and I would have disagreed with her back then for the same reason (had I read that report at the time). (Source: ABN AMRO) I’m not trying to take anything away from her calls, we must give her credit. Even though her price target for gold during 2014-2015 was off, she has been correct in the direction. That’s better than most other gold analysts, who seemed to be bullish on average over the last several years. I’m just trying to point out some weaknesses I see in this gold and silver price forecast and why I disagree with it. If you take a look at the historical price relationship between gold and silver on the monthly chart below, we haven’t really seen silver trade inverse to gold during any major spikes upward or downward. They track each other pretty consistently. For Ms. Boele to be correct, this historical correlation is going to have to be broken. I just don’t see this occurring. Gold Price in US Dollars data by YCharts As for her reasoning for lower gold prices ahead – due to a rising U.S. Dollar and increasing interest rates – well, I disagree with that too. I have talked enough in past articles how over the long term, the U.S. Dollar’s direction has no influence on the price of gold. It makes zero sense (economically and fundamentally) for there to be a long-term correlation. Hypothetical scenario – If Monday morning the Fed announced that it printed $10 trillion in fiat currency this weekend, and the ECB and other major central banks announced that they each printed $100 trillion of their own currencies, the USD would soar as other global central banks debased much more aggressively than the Fed. Gold wouldn’t decline in that scenario, it would rocket higher as well. The USD is just an index that shows where the Dollar is trading against other global fiat currencies. The USD will not be going down in this above-described scenario, but the value of the U.S. Dollar certainly will. They are two separate things. That’s what people get confused about. Gold measures the purchasing power of the U.S. Dollar, not where the U.S. Dollar is trading in relation to other fiat currencies. This is why over the long term, there is no correlation between the USD and gold. It’s why the USD was at 97 in 1978 and the gold price was at $200, and today the USD is at 97 and the gold price is at $1,100. This is a race to the bottom in the global currency game as each nation tries to inflate away their debt. There isn’t going to be a winner in all of this. If the U.S. Dollar goes up, it just means it’s the best of the worst. Gold is going to increase in value no matter what level the USD trades at. As for the Fed raising rates – and this hurting the price of gold – a picture says a thousand words. Gold soared along with interest rates in the 1970s. Gold has plunged as rates have been at zero percent over the last few years. History shows that an increasing interest rate environment is not negative for gold. Quite the opposite in fact. The reason for this is the Fed is always behind the curve when it comes to increasing rates as the Personal Consumption Expenditure (PCE) price index and Consumer Price Index (CPI) move up. (Source: FRED ) Ms. Boele did talk about rising interest rates ” in an environment where inflation expectations remain muted.” I can see her argument here, but while I do believe the Fed will start to raise rates initially, it will stop well short of its inflation target levels if its preferred inflation gauge doesn’t budge. In other words, I expect the Fed to continue to remain behind the curve and not attempt to get in front of it. I do believe that the gains in stocks and investors confidence in the market is what is holding gold back. As I have discussed in past articles that I have written over the last several months, gold’s biggest competition is the stock market. If I felt that the major indices would continue to increase over the coming years, then I could see a reason to stay bearish on gold. But my forecast remains that we are in the topping process for the general market, and gold will be bottoming during all of this. The way I see this playing out is investors start realizing that the stock market just isn’t going to be returning much this year. Most have become a little complacent and expected the strong annual gains we have seen since 2012 to continue. Now a lot of them are getting a little agitated/frustrated. These investors want high beta. And with the Fed about to raise rates, we will start to see some heavy liquidation take place as more people come to the realization that the party might be over. Given gold has been in decline during the markets rise, it’s the most logical asset class that all of this cash (that will be taken out of the market) will flow to. Especially when you consider the metal is at a much lower price level than it was in 2011, not to mention, it’s also highly volatile. And Here Comes Goldman Sachs… What would a gold smash party be without the presence of Goldman Sachs? Jeffrey Currie, head of commodities research at the firm, has been on the right side of this trade for a while now. He turned bearish in early 2013, issuing a sell call on gold in April of that year. A few days later, the price was down 13%, dropping from $1,550 to $1,350. Currie has continued his bearish stance since that time, coming out occasionally with lower and lower calls. Now he is saying gold under $1,000 is in the cards: We think we are in a structural bear market, not only in gold, but across the commodity complex, as the individual commodity stories are reinforcing to one another, creating a negative feedback loop…With the more positive outlook on the dollar, and with debasement risk starting to fade, the demand to use gold as a diversifying asset against the U.S. dollar becomes less and less important. Let me just say this, debasement risk hasn’t started to fade. As I touched upon in my previous article on GLD, if U.S. interest rates normalize, then net interest payments on the debt will balloon from $200 billion to $800 billion. We will be running $1 trillion annual deficits in the future if rates increase. The debt is just going to keep piling up. So debasement risk is still very much present, it’s just not at the forefront of the conversation because interest rates are currently low. Just because the “you know what” hasn’t hit the fan, doesn’t mean it’s not going to. Fantasy Not Reality I expect bearish forecasts to become even more bearish as GLD/gold move lower. That’s basic human nature. The more an asset goes down in value, the more fearful investors become, and the more outrageous the bearish calls get. Right now, we are seeing a lot of forecasts for gold to move under $1,000 (from yours truly as well). If we get a small bounce as I talked about earlier, then these might dissipate a little. But should gold eventually decline below that key level, then the bears will be out in full force, as will their outrageously low new price targets. $500 gold? Heck, why not $100? But these levels for gold are just fantasy, not reality. They are simply a result of people getting hyped up and too emotional when it comes to forecasting where prices will bottom. I would love for gold to go down to $300-$500. I would also love a Ferrari 250 GTO to go down in price from $30 million to $5 million. But I know those two things are not going to happen. There is “smart money” and then there is “dumb money.” And when prices of assets reach certain levels, the smart money always starts buying. This is all governed by the laws of supply and demand, as the smart money knows that when supply/demand fundamentals get all out of kilter, it’s time to buy. The only way we see those levels in gold being hit is if we had outright deflation. I’m not talking disinflation, I’m talking 1930’s style money destruction. Since we haven’t had deflation here in the U.S. since the Great Depression, and the U.S. Dollar isn’t backed by gold, I don’t believe that deflation is in our future; not with the debt levels we have here in the U.S., and certainly not when the Fed can easily inflate part of this debt away by just a few keystrokes. In Summary Capitulation in GLD has begun, the gold stocks were signaling this event for a few weeks now. The move lower in both GLD and the HUI over the last 6-7 trading days has been very aggressive. A little “too much too soon” if you ask me. We had an intraday reversal on Friday, so I’m expecting to possibly see some follow-through buying next week. GLD and gold stocks need to consolidate a bit here before they drop again. We are probably about 1/3 (maybe 1/2) of the way through this final sell-off of the bear market and the absolute bottom. Things might bounce slightly in the short term, but I see more downside ahead. If we don’t consolidate and just keep moving lower, then the bottom could be reached a little quicker than I’m anticipating. Long term, GLD and gold stocks are still the place to be positioned. With the market topping out, this gives gold the time it needs to form a final bear market low. And with the Fed raising rates soon, which will cause U.S. deficits to balloon again, investors need to own gold assets as USD currency debasement will soon become the main topic of concern again. The more gold sells off, the more bearish the price forecasts become. But the smart money will be buying when supply/demand fundamentals get out of kilter. That doesn’t occur at $500 gold either, it’s much higher. Disclosure: I/we have no positions in any stocks mentioned, and no plans to initiate any positions within the next 72 hours. (More…) I wrote this article myself, and it expresses my own opinions. I am not receiving compensation for it (other than from Seeking Alpha). I have no business relationship with any company whose stock is mentioned in this article.