Tag Archives: author

Best Multi-Asset ETFs For 2015
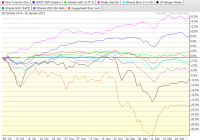
Summary MDIV remains the go to choice for a multi-asset ETF. Actively managed INKM saw its first test during a down market and it passed the test, outperforming the competition and emerging with an increased cash position. IYLD could find itself at the top of the heap at the end of 2015 if volatility remains elevated throughout the year. In last year’s article, The Best Multi-Asset ETF , I looked at which multi-asset ETFs were best under different conditions. Since the October 6 date of publication, there’s been a lot of volatility in the energy and currency markets, and several multi-asset ETFs were negatively impacted. For those who want a background on an individual fund, each of the seven ETFs was covered separately: Performance in Q4 2014 First, let’s look at a chart of the underlying assets held by most multi-asset ETFs. In the chart below are ETFs directly held by some multi-asset funds, or proxies which cover asset classes found in multi-asset funds. Along with MDIV are the SPDR S&P Dividend (NYSEARCA: DVY ), the iShares S&P U.S. Preferred Stock (NYSEARCA: PFF ), the iShares Cohen & Steers Realty Majors (NYSEARCA: ICF ), the iShares iBoxx $ High Yield Corporate Bond (NYSEARCA: HYG ), the JPMorgan Alerian MLP Index (NYSEARCA: AMJ ), the iShares MSCI EAFE (NYSEARCA: EFA ), the iShares MSCI Emerging Markets (NYSEARCA: EEM ) and the Guggenheim Canadian Energy Income (NYSEARCA: ENY ). (click to enlarge) That is a wide range of returns for a three-month period, partially because the start of the chart occurs during the early autumn sell-off in global markets. ICF doubled the return of its nearest competitor, which was dividend paying stocks. MDIV is in the middle of the pack along with preferred shares, junk bonds, and the EAFE. The big losses came from MLPs and Canroys, victims of the collapse in oil prices. Here’s a chart showing how multi-asset ETFs performed since October 6. (click to enlarge) Performance Review MDIV was given the title of Best Multi-Asset ETF because it spreads investments across asset classes such as REITs, MLPs, common stocks, preferred stocks, and junk bonds. The fund doesn’t take on extra risk to bump up its yield, incorporates some volatility factors in its model to reduce volatility, and should generally fall in the middle of the multi-asset ETF pack. MDIV gained 8.07 percent in 2014, and it mainly went sideways from October 6 on, gaining about 1.5 percent. MLPs are 20 percent of the portfolio and they under performed by a wide margin over the past three months, but REIT shares are also 20 percent of assets and they rallied more than MLPs fell. Overall, MDIV performed as expected, falling in the middle of the pack while delivering a positive return. GYLD was named the runner-up because it takes a global approach to the multi-asset model. However, enhanced risk was highlighted: GYLD used exposure to Venezuelan bonds and Canroys to achieve a higher yield. These assets were among the worst performers over the past three months and it led to a roughly 6 percent loss for the ETF. GYLD also fell 3.48 percent in 2014. As long as the U.S. dollar remains in a bull market, GYLD will struggle relative to domestic multi-asset ETFs, but energy is having a bigger impact on the portfolio. If energy remains weak, GYLD will lag the field. CVY was dubbed the “not-so-multi-asset-ETF” due to its hefty weight in common stocks, but it also made use of Canroys and MLPs to boost the portfolio’s total yield. The result was a heavy energy tilt: as of September 30, the most recent sector breakdown, CVY had 27 percent of assets in energy. This cost the fund over the past three months, and lowered CVY’s 2014 return to negative 4.33 percent. YDIV was the other poor performer over the past three months due to it being an international fund holding non-U.S. dollar assets. Australian and Canadian assets made up nearly 40 percent of assets back in September and 39 percent of the fund was in the two countries as of January 2, 2015. Australia and Canada are influenced by commodity prices, and Australian resource exports are hurt by the slowing Chinese economy. YDIV also has some assets in Chinese banks and Hong Kong companies, which raises the potential exposure to a China slowdown to more than 40 percent of assets. YDIV was going to underperform domestic multi-asset funds in 2014 no matter what simply due to being an international fund holding non-dollar assets, but it only fell 0.79 percent in 2014, and only 3.38 percent in the past three months because it isn’t directly exposed to commodities, specifically energy. This helped it beat both GYLD and CVY last year, two funds that were much more exposed to energy. IYLD was one of the stronger performers over the past three months because it mainly invests in bonds, to the tune of 75 percent of assets. Domestic dividend paying equities make up 10 percent of assets, with another 10 percent in international dividend paying equities, plus 5 percent in international real estate. IYLD also benefited from declining interest rates at the long-end; its 5 percent holding in the iShares Barclays 20+ Year Treasury (NYSEARCA: TLT ) was up 27 percent in 2014. IYLD rallied 10.29 percent for the full year and it climbed 1.88 percent in the past three months. The last two funds covered were FDIV and INKM, both actively managed. INKM’s performance was sub-par from its inception in April 2012, but financial markets enjoyed mostly smooth sailing for most of its life. Since October, INKM has beaten the multi-asset competition, gaining 3.41 percent in the past three months and 8.80 percent in 2014. INKM’s managers have adjusted the portfolio since September 25 (when I covered it here ). The fund raised cash from near 0 percent to 4 percent. High yield bonds are up from 6 percent to 9 percent. Equity exposure was cut from near 42 percent to 37 percent. Among individual holdings, the SPDR Barclays Long Term Treasury (NYSEARCA: TLO ) has climbed from 5.15 percent in September to 6.21 percent exposure. The SPDR Emerging Markets Dividend (NYSEARCA: EDIV ) was cut from 5.82 percent to 2.84 percent. The SPDR Dow Jones International Real Estate (NYSEARCA: RWX ) was raised from 4.85 percent to 6.23 percent. The SPDR Barclays High Yield Bond (NYSEARCA: JNK ) was increased from 6.09 percent to 8.95 percent. The SPDR Barclays Emerging Markets Local Bond (NYSEARCA: EBND ) was cut from 4.00 percent to 2.96 percent. One of the big questions with a fund such as INKM was how it might perform if markets moved against high-yield assets, such as due to rising interest rates. Long-term rates didn’t rise in late 2014, but energy prices tumbled, the dollar rallied sharply and high-yield bonds sold off. INKM managers navigated the past three months well and if they can keep it up, this fund will be a serious contender for investor capital. The 30-day SEC yield is still one of the lowest of the group at 3.25 percent, but if managers are able to mitigate losses during unfavorable periods for multi-asset ETFs, it could turn into a long-term outperformer. The other actively managed multi-asset ETF has a short history of only 5 months, but FDIV delivered similar results to INKM in the past three months, gaining 1.77 percent. Interestingly, FDIV’s managers moved in the opposite direction of INKM’s managers. Back on September 29, FDIV had 16.30 percent of assets in high-yield bonds and senior loans. As of January 2, the portfolio exposure to high-yield bonds was cut to 12.48 percent, with exposure to international sovereign bonds increased about 2 percentage points, MLP exposure increased 1 percentage point and dividend paying equities increased 1.5 points. FDIV has a 30-day SEC yield of 3.88 percent. After a rough period for multi-asset ETFs, both actively managed funds look more attractive today than they did three months ago. Best Fund For The Start of 2015 Assuming the U.S. dollar continues to strengthen, emerging markets and commodities remain weak and long-term interest rates do not rise, the following multi-asset ETFs look most attractive. For investors not worried about rising rates or trouble in high-yield bonds, but concerned about weakness in equities or MLPs, IYLD is a solid choice. It has 75 percent exposure to fixed income and a 5.83 percent yield, with dividends paid monthly. MDIV remains the go-to option for long-term passive investors. It won’t deliver big returns, but it yields 5.93 percent and also pays dividends monthly. If energy recovers and equities climb in 2015, MDIV will likely outperform IYLD. Given its track record over the past three months, INKM also looks attractive for total return investors who want active management. Of course, if you expect a big rebound in energy, GYLD or CVY look more attractive. GYLD currently yields 6.70 percent, but beyond risk of capital losses, there’s also the risk of dividend cuts if energy prices continue on their present trajectories.
How To Design A Market Neutral Portfolio

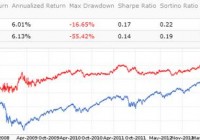
Summary For whom is Market Neutral investing. Making the short side safe. Two simple examples. Questions to solve for a real portfolio. An investment is market-neutral if it seeks to avoid exposure to market risk, typically by hedging. It can use various techniques, like statistical arbitrage in pairs trading, options in delta hedging, stock picking in long/short portfolios. This article is the first one of a series dealing with implementations of the latter category. Market Neutral Investor profile Market neutral strategies are suitable for investors who think that the market is approaching a correction or a crash, and more generally for those who want to invest without caring if the market is approaching a correction or a crash. It is especially pertinent for investors who don’t trust market timing, or who want a part of their investments to be independent of timing indicators. It is also pertinent for investors who are aware that several asset classes might sink together in specific deflationary environments, making inefficient the usual models of diversification in stocks, bonds, and hard assets. More generally, market neutral strategies attract risk-averse investors looking for capital protection, smoother drawdowns and a lower volatility. At the opposite, bullish investors used to long-only investing may be frustrated by an equity market neutral portfolio, which often underperforms the benchmark in a rising market, and whose equity curve may sometimes go down for a while whereas indices are going up. Making the short side safer An equity market-neutral portfolio generally holds equal amounts in a group of long positions and a group of short positions within a stock universe. The universe can be global (the whole stock market), focused on a country and market capitalization segment (for example the S&P 500 index), or specialized in a sector or industry (for example healthcare, biotechnology,…). I am personally reluctant to sell short individual stocks, and I know that I am not alone here. If you don’t understand why some of us don’t like short selling, just Google volkswagen short squeeze 2008 . I prefer replacing the short stock group with a unique position in an index ETF (generally DIA , SPY , IWM , IWV , QQQ depending on the universe). It significantly reduces the risks. My humble opinion is that if «Market Neutral» is for risk-averse investors, it is also better to avoid risks that are not related to the market (being trapped in a short squeeze in this case). All examples hereafter make this choice. Simple implementations The next article will show that designing a stock portfolio aiming at beating a benchmark in all market conditions is more complicated than just targeting a good risk-adjusted return. In a first step, I propose to delegate the stock picking job to an actively managed ETF: the First Trust Health Care AlphaDEX Fund (NYSEARCA: FXH ). One of my old articles ( here ) gives more information about FXH and its AlphaDEX siblings. This simulation is based on a portfolio composed of FXH on the long side and SPY on the short side rebalanced in equal weight every week. The leveraging factor is 2. Transaction costs and carry costs are accounted with respective rates of 0.01% and 2%. The next chart shows the period from 6/1/2007 to 1/2/2015. The portfolio equity curve is in red, SPY in blue. (click to enlarge) The return is not very exciting, but the risk in terms of drawdown and volatility is low. In fact, it is a stock-like return and a bond-like risk. What is not visible in a backtest is that such a strategy is less sensitive to geopolitical, macroeconomic and monetary events, than a bond portfolio. For the next example, I propose a little bit more work with a self-managed quantitative model. On the long side, I select 10% of Russell 3000 companies. The list is obtained by eliminating the 1000 companies with the worst Return on Equity (trailing 12 months), then keeping the 300 with the best Price to Free Cash Flow (trailing 12 months). On the short side, I choose the iShares Russell 3000 ETF . The portfolio is leveraged with a factor 2, rebalanced at a lower frequency of 4 weeks, with a carry cost of 2% and a transaction cost of 0.01%. The next chart shows a simulation on the period from 1/2/1999 to 1/2/2015. The portfolio equity curve is in red, the benchmark IWV in blue. (click to enlarge) The return is better than in the previous example, and the volatility is even lower (on a longer period). However, it is clearly visible that this market neutral portfolio underperforms its benchmark since April 2009. It is even in mild loss in 2014 (-1.5%). This illustrates the possible frustration in bull markets for investors who don’t understand, or are not interested in the long-term vision of such a strategy. This portfolio has 300 holdings: it is manageable for a fund, not for an individual investor. In a next article, I will explain how to get a better expected performance, how to keep the holding number reasonable yet the volatility low, why I use a meta-model to guarantee some sector diversification, and the best way to implement such a portfolio in an IRA account. Market Neutral investing is also possible without leveraging nor short selling. Feel free to follow me if you don’t want to miss this. Data and charts: Portfolio123 Additional disclosure: Past performance, real or simulated, is not a guarantee for the future.

ENFR Is An Energy Sector ETF That Might Fit Very Well Under Modern Portfolio Theory

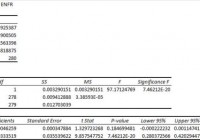
Summary I’m taking a look at ENFR as a candidate for inclusion in my ETF portfolio. The correlation to SPY is incredibly low but poor liquidity is reducing the reliability of statistics. The expense ratio is high and the holdings within the ETF could use more diversification. I wasn’t planning on using energy ETF, but the low correlation is too appealing. I’m not assessing any tax impacts. Investors should check their own situation for tax exposure. Investors should be seeking to improve their risk adjusted returns. I’m a big fan of using ETFs to achieve the risk adjusted returns relative to the portfolios that a normal investor can generate for themselves after trading costs. I’m working on building a new portfolio and I’m going to be analyzing several of the ETFs that I am considering for my personal portfolio. One of the funds that I’m considering is the Alerian Energy Infrastructure ETF (NYSEARCA: ENFR ). I’ll be performing a substantial portion of my analysis along the lines of modern portfolio theory, so my goal is to find ways to minimize costs while achieving diversification to reduce my risk level. What does ENFR do? ENFR attempts to track the total return (before fees and expenses) of the Alerian Energy Infrastructure Index. At least 90% of the assets are invested in funds included in this index. There are only 30 equity securities included in the index, so I’m expecting some diversification and volatility issues. ENFR falls under the category of “Energy Limited Partnership”. Does ENFR provide diversification benefits to a portfolio? Each investor may hold a different portfolio, but I use (NYSEARCA: SPY ) as the basis for my analysis. I believe SPY, or another large cap U.S. fund with similar properties, represents the reasonable first step for many investors designing an ETF portfolio. Therefore, I start my diversification analysis by seeing how it works with SPY. I start with an ANOVA table: (click to enlarge) The correlation appears incredible at 51%. I want to see low correlations on my investments. Extremely low levels of correlation are wonderful for establishing a more stable portfolio. I consider anything under 50% to be extremely low. However, for equity securities an extremely low correlation is frequently only found when there are substantial issues with trading volumes that may distort the statistics. The statistics appear too good to be true, which usually indicates that they are. I’ll keep an eye out for things that could distort the numbers. Standard deviation of daily returns (dividend adjusted, measured since November 2013) The standard deviation is very high for the relative calm sample period. For ENFR it is .9802%. For SPY, it is 0.6748% for the same period. While I’ve covered quite a few ETFs where the standard deviation was greater than 1%, those scores usually came from periods where SPY would have a standard deviation higher than .7200%. However, if the correlation really is 51%, I could work with the high deviations. Liquidity is a problem Average trading volume is running around 10,000 shares per day. It’s not completely illiquid, but it is pretty bad. In that time period, slightly under 280 trading days, the ETF reported a change from one closing value to the next (dividend adjusted) of 0.00% on 12 occasions. That might indicate days in which no shares changed hands, or the ending price might just have been the same as the prior day because of coincidence. For SPY, it happened 0 times during that period. However, SPY also trades at a much higher share price which reduces the chance of randomly having the same closing price since a one cent change in share price represents a smaller percentage of the price. The presence of 12 days in a sample of 280 is enough that it could have a meaningful influence on the calculated standard deviation and correlation of returns. I don’t think the poor liquidity is enough to explain away the correlation only being 51%, but it does reduce the reliability of the statistics. Mixing it with SPY I also run comparisons on the standard deviation of daily returns for the portfolio assuming that the portfolio is combined with the S&P 500. For research, I assume daily rebalancing because it dramatically simplifies the math. With a 50/50 weighting in a portfolio holding only SPY and ENFR, the standard deviation of daily returns across the entire portfolio is 0.7227%. With 80% in SPY and 20% in ENFR, the standard deviation of the portfolio would have been .6615%. If an investor wanted to use ENFR as a supplement to their portfolio, the standard deviation across the portfolio with 95% in SPY and 5% in ENFR would have been .6673%. Why I use standard deviation of daily returns I don’t believe historical returns have predictive power for future returns, but I do believe historical values for standard deviations of returns relative to other ETFs have some predictive power on future risks and correlations. Yield & Taxes The distribution yield is 1.97%. I like to see strong yields for retiring portfolios because I don’t want to touch the principal. By investing in ETFs I’m removing some of the human emotions, such as panic. Higher yields imply lower growth rates (without reinvestment) over the long term, but that is an acceptable trade off in my opinion. The poor liquidity would still concern me for any investor that needed even a moderate level of liquidity in the portfolio. I’m not a CPA or CFP, so I’m not assessing any tax impacts. Expense Ratio The ETF is posting an expense ratio of .65%. I want diversification, I want stability, and I don’t want to pay for them. I’m not attracted to the high expense ratio, but I won’t eliminate the ETF on the grounds of a high expense ratio because I’m still intrigued by the very low correlation. Market to NAV The ETF is at a .07% premium to NAV currently. Premiums or discounts to NAV can change very quickly so investors should check prior to putting in an order. I wouldn’t consider .07% to be meaningful, but investors should still watch out for the bid-ask spread. Poor liquidity is frequently connected with larger spreads. Largest Holdings The diversification within the ETF is fairly bland. I expected that because the underlying index had a fairly limited number of securities as well. In my opinion, the most reasonable way to use this ETF would be as a fairly small position within a large portfolio in which the investor was willing to sink in a little time watching for the right times to enter. Specifically, they would need to be watching the spread and the premium or discount to NAV. Additionally, the investor would need to be aware of their risk tolerances and liquidity needs. For an investor that meets all those criteria, this ETF might work. (click to enlarge) Conclusion I’m currently screening a large volume of ETFs for my own portfolio. The portfolio I’m building is through Schwab, so I’m able to trade ENFR with no commissions. I have a strong preference for researching ETFs that are free to trade in my account, so most of my research will be on ETFs that fall under the “ETF OneSource” program. I’m going to keep ENFR on my list as a potential candidate despite the fairly poor liquidity and high expense ratio. I don’t have a portion of the portfolio set aside for energy stocks, so the odds may be stacked against ENFR. If ENFR is selected, it would probably be used as 3% to 5% of the portfolio value. The major incentive for me is the low correlation, so I would want to run more statistical testing on the correlation over different time periods to reduce the risk of poor liquidity creating a misleading picture. Additional disclosure: Information in this article represents the opinion of the analyst. All statements are represented as opinions, rather than facts, and should not be construed as advice to buy or sell a security. Ratings of “outperform” and “underperform” reflect the analyst’s estimation of a divergence between the market value for a security and the price that would be appropriate given the potential for risks and returns relative to other securities. The analyst does not know your particular objectives for returns or constraints upon investing. All investors are encouraged to do their own research before making any investment decision. Information is regularly obtained from Yahoo Finance, Google Finance, and SEC Database. If Yahoo, Google, or the SEC database contained faulty or old information it could be incorporated into my analysis. The analyst holds a diversified portfolio including mutual funds or index funds which may include a small long exposure to the stock.