Tag Archives: author

SLYV Doesn’t Offer Enough Value For My Portfolio
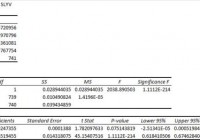
Summary I’m taking a look at SLYV as a candidate for inclusion in my ETF portfolio. The expense ratio is a tad high, but diversification isn’t bad. The correlation with SPY isn’t bad, but the daily returns are more volatile than SLYG. I don’t think I’ll be using SLYV in the foreseeable future. I’m not assessing any tax impacts. Investors should check their own situation for tax exposure. Investors should be seeking to improve their risk adjusted returns. I’m a big fan of using ETFs to achieve the risk adjusted returns relative to the portfolios that a normal investor can generate for themselves after trading costs. I’m working on building a new portfolio and I’m going to be analyzing several of the ETFs that I am considering for my personal portfolio. One of the funds that I’m considering is the SPDR® S&P 600 Small Cap Value ETF (NYSEARCA: SLYV ). I’ll be performing a substantial portion of my analysis along the lines of modern portfolio theory, so my goal is to find ways to minimize costs while achieving diversification to reduce my risk level. What does SLYV do? SLYV attempts to provide results which are comparable (before fees and expenses) to the total return of an unnamed index that tracks small capitalization “value” equity securities in the U.S. By not defining a specific index, it would be difficult for SLYV to fall short of that objective. It may sound like I’m unimpressed with the fund before I even begin the analysis. To an extent, that’s true. I want to see a specific index named so that investors can check how accurately the ETF is tracking that index. I checked the official prospectus to see if there was a mistake. It seems there really is no defined index. SLYV falls under the category of “Small Value”. Does SLYV provide diversification benefits to a portfolio? Each investor may hold a different portfolio, but I use (NYSEARCA: SPY ) as the basis for my analysis. I believe SPY, or another large cap U.S. fund with similar properties, represents the reasonable first step for many investors designing an ETF portfolio. Therefore, I start my diversification analysis by seeing how it works with SPY. I start with an ANOVA table: (click to enlarge) The correlation is about 85.6%, which is great for Modern Portfolio Theory. The lower correlation makes it much easier to mix the ETF into a portfolio and take advantage of the benefits of diversification. My goal is risk adjusted returns, and my method is minimizing risk. Standard deviation of daily returns (dividend adjusted, measured since January 2012) The standard deviation is moderately high, but not terrible. For SLYV it is .9673%. For SPY, it is 0.7300% for the same period. SPY usually beats other ETFs in this regard, and the low correlation with SPY makes the higher standard deviation acceptable. Mixing it with SPY I also run comparisons on the standard deviation of daily returns for the portfolio assuming that the portfolio is combined with the S&P 500. For research, I assume daily rebalancing because it dramatically simplifies the math. With a 50/50 weighting in a portfolio holding only SPY and SLYV, the standard deviation of daily returns across the entire portfolio is 0.8183%. If an investor wanted to use SLYV as a supplement to their portfolio, the standard deviation across the portfolio with 95% in SPY and 5% in SLYV would have been .7354%. Ironically, when I compared the growth version of this fund (NYSEARCA: SLYG ), which is very similar except for investing in “growth” securities, SLYG had lower correlation and a lower standard deviation of returns. I would have expected SLYG to have lower correlation than SLYV, but I would not have expected it to exhibit a smaller standard deviation of returns. In short: SLYV performed worse on both risk metrics than SLYG. Liquidity The average trading volume was a little over 30,000 shares, which is high enough that I’m not concerned. Why I use standard deviation of daily returns I don’t believe historical returns have predictive power for future returns, but I do believe historical values for standard deviations of returns relative to other ETFs have some predictive power on future risks and correlations. Yield & Taxes The distribution yield is 1.36%. The SEC yield is 1.37%. That yield isn’t terrible, but investors won’t be able to retire on yields that are significantly under 2%. In my opinion, this is a difficult space for an ETF to be in. The “value” realm can be associated with less volatility and higher yields which make it more appealing for retirees. This “value” ETF doesn’t have enough yield to be strong in the category but offered more volatility and correlation to SPY than the growth ETF. I’m not a CPA or CFP, so I’m not assessing any tax impacts. Expense Ratio The ETF is posting .25% for an expense ratio. I want diversification, I want stability, and I don’t want to pay for them. The expense ratio on this fund is not too bad, but I’d like to see it lower for an ETF that invests in U.S. equity securities. Market to NAV The ETF is at a .17% premium to NAV currently. Premiums or discounts to NAV can change very quickly so investors should check prior to putting in an order. I wouldn’t want to pay a premium greater than .1% when investing in an ETF, unless I could find a solid accounting reason for the premium to exist. Largest Holdings Just like SLYG, the diversification is fairly solid. No investment is over 1% of the portfolio, but that also isn’t diversified enough to explain the .25% expense ratio. (click to enlarge) Conclusion I’m currently screening a large volume of ETFs for my own portfolio. The portfolio I’m building is through Schwab, so I’m able to trade SLYV with no commissions. I have a strong preference for researching ETFs that are free to trade in my account, so most of my research will be on ETFs that fall under the “ETF OneSource” program. I just don’t see enough benefits to SLYV to try to use it in the portfolio. Due to the low correlation, an investor may find a 1% exposure to be very reasonable. For me, 1% simply isn’t large enough when investing in ETFs. Additional disclosure: Information in this article represents the opinion of the analyst. All statements are represented as opinions, rather than facts, and should not be construed as advice to buy or sell a security. Ratings of “outperform” and “underperform” reflect the analyst’s estimation of a divergence between the market value for a security and the price that would be appropriate given the potential for risks and returns relative to other securities. The analyst does not know your particular objectives for returns or constraints upon investing. All investors are encouraged to do their own research before making any investment decision. Information is regularly obtained from Yahoo Finance, Google Finance, and SEC Database. If Yahoo, Google, or the SEC database contained faulty or old information it could be incorporated into my analysis. The analyst holds a diversified portfolio including mutual funds or index funds which may include a small long exposure to the stock.
Technology ETF: XLK No. 3 Select Sector SPDR In 2014

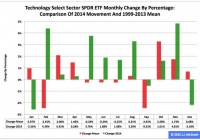
Summary The Technology exchange-traded fund finished third by return among the nine Select Sector SPDRs in 2014. As it did so, the ETF was weak at the beginning and the end of the year, while strong in the months in-between. Seasonality analysis of the first quarter is a mixed bag, but my data interpretation suggests a constrained return. The Technology Select Sector SPDR ETF (NYSEARCA: XLK ) in 2014 ranked No. 3 by return among the Select Sector SPDRs that cleave the S&P 500 into nine fragments. On an adjusted closing daily share-price basis, XLK climbed to $41.35 from $35.09, a hike of $6.26, or 17.84 percent. It thus behaved better than its parent proxy, the SPDR S&P 500 Trust ETF (NYSEARCA: SPY ) by 4.38 percentage points, but worse than its sibling, the Utilities Select Sector SPDR ETF (NYSEARCA: XLU ) by -10.90 points. (XLK closed at $41.25 Friday.) XLK ranked No. 7 among the sector SPDRs in the fourth quarter, when it lagged XLU and SPY by -9.00 and -0.72 percentage points, in that order. And XLK ranked No. 9 among the sector SPDRs in December, when it performed worse than XLU and SPY by -5.75 and -1.92 percentage points, respectively. Figure 1: XLK Monthly Change, 2014 Vs. 1999-2013 Mean (click to enlarge) Source: This J.J.’s Risky Business chart is based on analyses of adjusted closing monthly share prices at Yahoo Finance . XLK behaved a lot better in 2014 than it did during its initial 15 full years of existence based on the monthly means calculated by employing data associated with that historical time frame (Figure 1). The same data set shows the average year’s weakest quarter was the third, with an absolutely large negative return, and its strongest quarter was the fourth, with an absolutely large positive return. Inconsistent with this pattern, the ETF had excellent gains each and every quarter last year. Figure 2: XLK Monthly Change, 2014 Versus 1999-2013 Median (click to enlarge) Source: This J.J.’s Risky Business chart is based on analyses of adjusted closing monthly share prices at Yahoo Finance. XLK also performed a lot better in 2014 than it did during its initial 15 full years of existence based on the monthly medians calculated by using data associated with that historical time frame (Figure 2). The same data set shows the average year’s weakest quarter was the second, with a relatively small positive return, and its strongest quarter was the fourth, with an absolutely large positive return. Meanwhile, there is a big difference between the monthly mean and median performances of the ETF in Q1: Personally, I parse the relevant data more bearishly (consistent with the mean) and less bullishly (inconsistent with the median) in the current context. Figure 3: XLK’s Top 10 Holdings and P/E-G Ratios, Jan. 9 (click to enlarge) Note: The XLK holding-weight-by-percentage scale is on the left (green), and the company price/earnings-to-growth ratio scale is on the right (red). Source: This J.J.’s Risky Business chart is based on data at the XLK microsite and FinViz.com (both current as of Jan. 9). XLK appears poorly positioned to be a standout among the Select Sector SPDRs, either this quarter or this year, given factors discussed in “PowerShares QQQ’s 2014 And Fourth-Quarter Performance And Seasonality.” Basically, I anticipate one of the biggest headwinds buffeting the U.S. technology sector in general and XLK in particular over the foreseeable future may be the bias divergence in monetary policy at major central banks around the world. On the one hand, the U.S. Federal Reserve is oriented toward tightening; on the other hand, the Bank of Japan, European Central Bank and People’s Bank of China are oriented toward loosening. This divergence has had important effects on exchange rates, such as in the euro and U.S. dollar currency pair, or EUR/USD. It is worth mentioning in this context that the Fed announced the end of asset purchases under its latest quantitative-easing program, aka QE3+, Oct. 29 and may announce the beginning of interest-rate hikes April 29. Its conclusion of purchases under its first two formal QE programs this century is associated with both a correction and a bear market in large-capitalization equities, as evidenced by SPY’s declines of -17.19 percent in 2010 and -21.69 percent in 2011. The bias divergence at the major central banks has been reflected by action in the EUR/USD cross, which slipped from as high as $1.3992 May 8 to as low as $1.1753 Jan. 8, a slide of -$0.2239, or -16.00 percent, based on data at StockCharts.com. This change in EUR/USD and similar moves in other currency pairs indicate a strengthening greenback and a weakening everything else could pressure earnings of U.S. companies in sectors with substantial international businesses. And XLK encompasses many firms fitting this description, with its exposure to either the tech or the telecommunications sectors at about 100 percent, per its microsite. Meanwhile, the valuations of the ETF’s top 10 holdings seem unlikely to function as tailwinds for it this quarter (Figure 3). Nonetheless, the S&P 500 information-technology sector does not strike me as hideously overvalued, with S&P Senior Index Analyst Howard Silverblatt reporting Dec. 31 its P/E-G ratio was 1.20. Of course, it was a different story with the index’s telecommunications-services sector, with Silverblatt reporting at the same time its P/E-G ratio was 2.16. Disclaimer: The opinions expressed herein by the author do not constitute an investment recommendation, and they are unsuitable for employment in the making of investment decisions. The opinions expressed herein address only certain aspects of potential investment in any securities and cannot substitute for comprehensive investment analysis. The opinions expressed herein are based on an incomplete set of information, illustrative in nature, and limited in scope. In addition, the opinions expressed herein reflect the author’s best judgment as of the date of publication, and they are subject to change without notice.

Avoid The Value Trap To Achieve Higher Returns

Summary Be wary of value traps in banks, oil and consumer stocks. My sweet attraction to Tootsie Roll goes sour. I paid a premium for my top stocks. Value investors spend their lives in the trenches buying stocks at deep discounts to their peers. They believe their bottom feeding will produce top returns. But sometimes these discounted stocks are a “Value Trap” that never go anywhere. Investopedia says, “The trap springs when investors buy into the company at low prices and the stock never improves. Trading that occurs at low multiples of earnings, cash flow or book value for long periods of time might indicate that the company or the entire sector is in trouble, and that stock prices may not move higher.” There are value traps in all sectors, but I believe traps are common in Oil, Banking and Consumer stocks. I will explore value traps in all three sectors. Candy stocks In the 1990s and 2000s, I had success investing in the William Wrigley Co., achieving 15% annual returns until the stock was sold to Mars at 32 times expected earnings in 2008. I was sad to see that stock leave my portfolio. I looked for other candy companies to purchase. I invested some money in Tootsie Roll (NYSE: TR ). Tootsie Roll has a great story and popular products that are part of American confectionery history, its most well known ad campaign in the 1970s was “How many licks does it take to get to the center of a Tootsie Pop?” The company has solid fundamentals, minimal debt, good cash flow and popular brands. TR trades at a P/E of 29, similar to Hershey (NYSE: HSY ). In the mid 2000s, I bought a few shares of TR at $24 per share, but the stock never went anywhere. I figured some day the Gordon family that owns the majority of stock in Tootsie Roll would eventually sell out and relinquish control. Ellen and Melvin Gordon have run Tootsie Roll for decades and have no plans to step down. After holding my Tootsie Roll stock for a year, I sold the shares for about the same price that I had paid for them. The stock moved to $29.80 per share recently. There is more value in Tootsie Roll, but how long can investors wait for that to be realized? I started buying Hershey stock at around $65 per share. Hershey was up 193% over the past five years compared with 25% for Tootsie Roll. I’m glad I put my money with Hershey. Energy Investors who chased the energy sector seeking deep-discount stocks with fat dividend yields have taken some hits lately. The energy play has produced big-time losses due to the -50% drop in oil prices. Stocks like Sandridge Energy (NYSE: SD ) are hurting. Low oil prices will cut demand for Sandridge’s oil and gas exploration business. SD was down -67% over the past three months. I see many investors looking for an opportunity in Seadrill (NYSE: SDRL ). Seadrill is trading at forward 3.68 P/E and trailing 1.22 P/E. The stock is trading at half of its stated book value. It looks cheap. But a closer look and you see earnings growth is not there. In fact, YOY quarterly earnings growth is a negative -47%. I question SDRL’s $20.93 book value. With oil prices cut in half, the company’s assets are probably worth substantially less at this time. SDRL cut its dividend to save cash. SDRL will lose business in 2015. Who wants to pay for its expensive ocean drilling systems if cheap oil is plentiful on land? Banking I know bankers who really got hammered with the stock market crash in 2008-09. Bank of America (NYSE: BAC ) used to trade over $40 per share in the mid 2000s, but fell to $3.00 per share in 2009. The stock recently hit $16.90 per share, but has never fully recovered its pre-recession share price. Meanwhile if you had owned the S&P500 or (NYSEARCA: SPY ) before, during and after the Great Recession, you would have recovered your principle by 2012 and made phenomenal returns of 32% in 2013 and 13.5% in 2014. BAC is trading at 81% of book value. Citi is trading at around 80% of tangible book value. This may be a classic value trap. Banco Santander S.A. (NYSE: SAN ) is trading around 86% of book value compared with Wells Fargo (NYSE: WFC ) trading at 1.67 times book value. SAN has decided to raise more capital through issuing stock. This will dilute shareholder value. Banks are over-regulated, pay high expenses on legal issues and deal with a low-interest rate environment that makes it difficult to earn money. Regulators want banks to maintain high capital levels. With interest rates so low, banks can’t pay much on savings accounts. Every time you turn around, a lawmaker wants to propose new, tougher standards for banks. Banks already spend a lot of money on internal controls, legal and compliance. Don’t buy bank stocks with the idea interest rates are going up because we may see low interest rates for many more years. The 10-year Treasury actually fell from 3.00% to 2.00% in 2014. U.S. bond yields remain low due to worldwide pressures keeping rates down. The Federal Reserve is in no hurry to raise rates, although it hinted we might see an uptick in rates by summer 2015. If I had waited for deep-discount prices on my favorite stocks, I might not have bought them except in 2009 when all financial assets deflated. I paid a premium for my favorite stocks and bought them on the dips. Now these stocks represent the most consistent and profitable returns in my portfolio. These quality stocks are Berkshire Hathaway (BRK.B, BRK.A), Union Pacific (NYSE: UNP ), Hershey, Church & Dwight (NYSE: CHD ), Boston Beer (NYSE: SAM ) and Dominion Resources (NYSE: D ). I bought these stocks using a multiple-buy-on-the-dips approach that reduced risk and increased my returns. A stock’s value is really dependent on a stock’s future earnings potential. Positive, upside surprises on earnings usually drive stocks higher. If a company produces higher levels of earnings year after year without diluting shares, the stock eventually will move up in price. But if the prospects for earnings growth is taken away, the stock may never appreciate. Conclusion Buy companies that generate large amounts of cash daily, have minimal or no debt and that don’t get in trouble with the government. Watch out for the value trap. I’m staying away from oil and banking stocks to devote more capital to my winners. Don’t chase losers into the hole of no return. Money not lost is money ahead.