Tag Archives: author

CenterPoint Energy, Inc: Come For The Value, Stay For The Yield

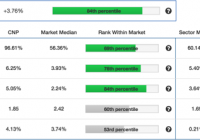
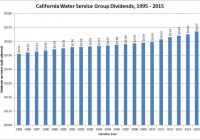
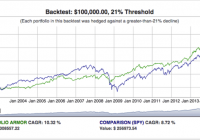
Summary Utilities sector is ready to rebound after a poor 2015. CNP has one of the highest dividend yields in the sector at 5.05%. Stock looks undervalued relative to the market and sector. Recent trends show positive investor sentiment. We rate CNP as outperform for the next 12 months. (The following article was written by Quantified Alpha contributing analyst Clement Kwong, CFA level 3 candidate.) Introduction CenterPoint Energy (NYSE: CNP ) is headquartered in Houston, Texas delivering energy and natural gas to approximately 25,000 customers across 20 states. CNP has a market cap of just over $8 billion, and has one of the highest dividend yields in the industry as well as the market. Given the mixed results we’ve seen from the latest economic data, a delay in raising rates could see investors search for income from dividend paying stocks. After being down almost 8% year to date, the utilities sector is experiencing a rally since June gaining over 6% during that time. CNP released Q2 earnings this week with mixed results. Although earnings of 19 cents were in line with analyst’s estimates, revenues of $1.5 billion missed analyst’s expectation of around $1.8 billion. On the positive side, operating income from electric transmission and distribution increased from $145 million in Q2 2014 to $158 million in Q2 2015 representing growth of about 9%. Management reaffirmed full year guidance of $1.00-$1.10 per diluted share while targeting a 4-6 percent growth in dividends and earnings through 2018. We believe CNP offers investors great value as well as one of the highest dividend yield in the market. Value Overview Taking a quantitative approach, our analysis looks at certain metrics that have a strong predictive ability. Historical back testing has shown that companies that rank in the top of these metrics have had excessive average return relative to the market. (click to enlarge) Source Our model output suggest CNP is quite undervalued when compared to the market and sector. With an earnings yield of 6.25%, CNP is trading at around 15X multiplies, well below the sector median of 18X. CNP also has a very impressive sales yield putting them in the 69th percentile of the market while boasting a solid free cash flow yield at 4.13%. Historical back testing has shown that on average, stocks with high cash flow yield have significantly outperformed stocks with low cash flow yield. As mentioned earlier, CNP also has one of the markets highest dividend yields at 5.05% putting them in “Dividend Channel’s” top 10 dividend paying utility stocks for 2015. Growth Overview After earnings almost doubled in 2014, first quarter earnings were down around 40% causing the stock to underperform relative to the sector. We believe the 16% drop in price over the last 12 months to be a great entry point for investors looking for an undervalued stock. With CNP’s improving return on equity and assets right in line with the market median, their ability to maintain growth in earnings will be important for investors to see that the company is going in the right direction. (click to enlarge) Source Sentiment Overview Investor’s sentiment has been positive as CNP’s short ratio has been fairly low at 1.89%. The low ratio indicates the low level of confidence in short sellers betting against CNP, suggesting a rally is in sight. We believe short interest is a good indicator of future returns due to short sellers having more information than retail investors. The positive sentiment is also supported by strong insider ownership. In May, the director and vice president bought up 12,000 shares suggesting that management is confident that the company will turn it around. Although there was little change in institutional ownership, the combination of a low short ratio as well as high insider ownership suggests that CNP is poised to outperform in the year to come. (click to enlarge) Source Outlook The effects of low commodity prices and milder weather have put downward pressure on the utility sector. As a result, utilities have been one of the weakest performing sector in 2015. With little relief in sight for commodity prices, it will be important for CNP to grow their customer base in electric transmission and distribution. Results from Q2 earnings show that CNP grew the number of metered residential customers by 2%, right in line with expectations. Due to limited competition in areas where CNP services, CNP should be able to offset weaker margins from its natural gas and energy business so long as its able to continue growing its customer base by 2%. The performance of CNP’s natural gas and energy line has been quite poor relative to previous years due to the low prices of oil and gas. With prices expected to stay low in the near term, CNP’s success in the electric transmission and distribution space will be essential for future success. We also like CNP because of management’s commitment to grow dividends over the next several years. A growing dividend will provide shareholders with return on their investment even when the stock is underperforming. After an extended period of price decline, we believe CNP is ready for a rebound. With solid fundamentals supported by positive investor sentiment, CNP has an attractive quantitative profile that should outperform the market over the next 12 months. Our equity pricing model uses historical back testing to predict the excess returns that a stock will generate. Using the CAPM model, we combine the stock’s calculated alpha with the stock’s beta to predict a range of 12-month target prices. Our base case scenario predicts a price target of $22.99 representing upside of 17% compared to Wall Street’s target price of $21.67 which represents upside of 11%. Our model projects with 75% probability that CNP’s stock price will be between $20.58-$24.33 over the next twelve months. (click to enlarge) Source Disclosure: I/we have no positions in any stocks mentioned, and no plans to initiate any positions within the next 72 hours. (More…) I wrote this article myself, and it expresses my own opinions. I am not receiving compensation for it (other than from Seeking Alpha). I have no business relationship with any company whose stock is mentioned in this article.

Dividend Growth Stock Overview: California Water Service Group

About California Water Service Group California Water Service Group (NYSE: CWT ) is a holding company with six operating subsidiaries that provide regulated and non-regulated water utility service to nearly 500,000 customers in four states. The regulated subsidiaries are California Water Service Company (Cal Water), New Mexico Water Service Company, Washington Water Service Company, and Hawaii Water Service Company. Non-regulated services – like billing and meter reading services, and leasing antenna sites to telecommunications companies, are provided by the CWS Utility Services and HWS Utility Services subsidiaries. The company dates back to the formation of Cal Water in 1926. California Water Service Group organizes all of its business into a single segment. Nearly all (94%) of the company’s customers and revenues come from business conducted in California. More than half of the California customers are in the greater San Francisco Bay area; the rest of the customers are in locations throughout the rest of the state. The Hawaii Water Services and HWS Utility Services subsidiaries serve 4,300 customers on the islands of Maui and Hawaii. The Washington Water Services subsidiary serves 16,300 customers in the Tacoma and Olympia areas, and the New Mexico Water Services subsidiary serves 7,600 customers in three communities between Albuquerque and Las Cruces, NM. In 2014, California Water Service Group earned $56.7 million on revenues of $597.5 million. These figures were up 20.0% and 2.3%, respectively from 2013. The increase in net income was due to the approval of a 9.2% rate increase by the California Public Utilities Commission (CPUC). The CPUC has approved future rate increases of 1.9% in 2015 and 1.8% in 2016. Earnings per share were up in 2014 as well, by 16.7% to $1.19. With the current annualized dividend rate of 67 cents per share, the company’s payout ratio is 56.3%. The company has stated that it targets a payout ratio of 60%, giving the company a bit more room to grow the dividend. The company is a member of the Russell 2000 index and trades under the ticker symbol CWT. California Water Service Group’s Dividend and Stock Split History (click to enlarge) California Water Service Group has grown its dividends slowly, compounding them at a rate of less than 2% over the last quarter century. California Water has paid dividends since 1945 and increased them since 1968. The company regularly announces increases at the end of January, with the stock going ex-dividend towards the middle of February. In January 2015, California Water announced a 3.08% increase in its dividend to an annualized rate of 68 cents per share. California Water should announce its 49th annual dividend increase in January 2016. Like many public utilities, California Water has grown its dividend very slowly over its history. Since 2001, the largest increase in the quarterly dividend has been half a cent, resulting in a 5-year dividend growth rate of 2.40%. Longer term, the dividend growth rates are even slower, with the company posting a 25-year dividend growth rate of 1.74%. The company has split its stock six times. The first split, 4-for-1, occurred in 1940. The next split occurred in March 1959 and was 2-for-1. It would be another 25 years until the stock split again – in May 1984, the company split the stock 2-for-1 again. The remaining three splits were also 2-for-1 and occurred in October 1987, January 1998 and, most recently, in June 2011. Over the 5 years ending on December 31, 2014, California Water Service stock appreciated at an annualized rate of 9.21%, from a split-adjusted $15.62 to $24.27. This underperformed the 13.0% compounded return of the S&P 500 and the 14.0% compounded return of the Russell 2000 Small Cap indices over the same period. California Water Service Group’s Direct Purchase and Dividend Reinvestment Plans California Water Service has both direct purchase and dividend reinvestment plans. You do not need to be a current investor in California Water Service to participate in the plans. The minimum investment amount is $250 for new investors and $25 for existing shareholders. The dividend reinvestment plan does allow for partial reinvestment of dividends. The plans’ fee structures are favorable to investors, with the company picking up all costs on stock purchases, both directly and through dividend reinvestment. When you go to sell your shares, you’ll pay a transaction fee of $15 plus a commission of 10 cents per share. All fees will be deducted from the sales proceeds. Helpful Links California Water Service Group’s Investor Relations Website Current quote and financial summary for California Water Service Group (finviz.com) Information on the direct purchase and dividend reinvestment plans for California Water Service Group Disclosure: I do not currently have, nor do I plan to take positions in CWT.

Backtesting The Hedged Portfolio Method

The hedged portfolio method enables investors to precisely specify and strictly limit their risk. From 1/2/2003 to 4/30/2014, net of trading fees and hedging costs, the hedged portfolio method generated a CAGR as high as 11.06% versus 8.72% for SPY. The security selection method generated alpha using price history and options market sentiment. The backtests uncovered interesting relationships between hedging methods, costs, and security returns. The Hedged Portfolio Method The goal of the hedged portfolio method is to generate competitive returns for an investor while strictly limiting his risk. For example, an investor unwilling to risk more than a 10% drawdown over the next six months (i.e., an investor whose “threshold” was 10%) could invest in a hedged portfolio structured to maximize his expected return while insuring that, in the worst case scenario (each of his underlying securities going to zero), his portfolio would decline no more than 10% over that time period. Our backtests determined that the hedged portfolio method can achieve competitive returns while strictly limiting risk. Below, for example, is a chart showing the performance of a series of 21% threshold hedged portfolios from 1/2/2003 to 4/30/2014, versus the performance of SPY over the same period. (click to enlarge) How It Works In broad strokes, this is the process for creating a hedged portfolio: Calculate a potential return for every hedgeable security in your universe (the Portfolio Armor universe consists of the 3,000+ hedgeable stocks and exchange traded products traded in the U.S.). Calculate the cost of optimally hedging each security. Subtract 2. from 1. to get potential returns net of hedging costs, or net potential returns. Rank the securities in order of their net potential returns. Pick a handful of the securities with the highest net potential returns to populate a concentrated portfolio and hedge them according to the investor’s risk tolerance. There are a few additional steps we employ to minimize cash levels and maximize potential returns, but that’s the basic idea. Here is an example of what a hedged portfolio looks like. That one was created on August 11th, 2015, and was designed for an investor who wanted to invest $1,000,000 while limiting his downside risk to a drawdown of no more than 18% over the next six months. That portfolio includes the stocks with highest potential returns in Portfolio Armor’s universe as of that date: Amazon, Inc. (NASDAQ: AMZN ), Expedia, Inc. (NASDAQ: EXPE ), Mondelez (NASDAQ: MDLZ ), Norwegian Cruise Line Holdings (NASDAQ: NCLH ), Netflix, Inc. (NASDAQ: NFLX ), Regeneron Pharmaceuticals (NASDAQ: REGN ), and Tyler Technologies (NYSE: TYL ). It’s clear that the first step in creating a hedged portfolio, calculating potential returns, is crucial, for two reasons: first, if you can’t select securities with the potential to generate alpha, your hedged portfolio returns will lag; second, in order to know if it’s worth the cost of hedging the securities, you need to have an idea of how accurate your potential returns are. So, before backtesting the hedged portfolio method as a whole, first we backtested our security selection method. Backtesting Our Security Selection Method Every trading day, Portfolio Armor generates high-end estimates of how more than 3,000 stocks and exchange traded products will perform over approximately the next six months. These estimates are based on analysis of historical returns as well as option market sentiment (determined by the cost of hedging each security in various ways), which provides a forward-looking element. We call this high-end estimate a security’s potential return. Essentially, it’s how the security might perform over the next six months in a bullish scenario. We backtested this method by running our analysis every trading day from 1/2/2003 to 10/31/2013 and then looking at the actual returns of the securities with the highest potential returns on our daily scans over the next six months. Over that 11-year period, we conducted 25,412 comparisons of our calculated potential returns to actual returns, an average of 9.4 top-ranked securities each trading day. The average potential return we calculated was 22.4%. The average actual return over the next six months, unhedged, was 6.84%. Since the average actual return was 0.3x the average potential return, we use that 0.3x multiple to derive expected returns from our potential returns. While a potential return represents a bullish upside, an expected return is the more likely result. A subset of our top-ranked securities – 5,202 of them, or about 20% of them – had an even higher average actual return: 9.35%. All of our top-ranked securities were hedgeable with optimal collars, but the securities in this subset were also hedgeable with optimal puts (we call these AHP securities, for short). There aren’t always AHP securities available, but when there are, our portfolio construction algorithm gives preference to them proportional to their higher average returns in our tests. Specifically, we increase their potential returns by 37%, since 9.35% is 1.37x 6.84%. The security returns mentioned above were unhedged; we also tested gross returns (i.e., not net of hedging costs) of our security selection method while hedging against greater-than-9% declines. When doing so with optimal puts, the average gross return was 12.08% over six months. The average gross return for the same securities when hedged with optimal collars capped at their potential returns was about half as much, 6.25%. This illustrates to what extent the average actual returns of the securities hedged with optimal puts were driven by outliers – securities that appreciated beyond our calculated potential returns. We adjust for the impact of potential outliers during the portfolio construction process, by only hedging with optimal collars when the net potential return is greater than 1.93x that of the same security when hedged with an optimal put (since 12.08/6.25 = 1.93). Backtesting The Hedged Portfolio Method To backtest the hedged portfolio method, we started searching for a hedged portfolio at each threshold on 1/2/2003. Hedged portfolios were run for six months, or until all positions had been exited, whichever came first, and then the ending dollar amount of the first portfolio was used as the starting dollar amount of the second sequential portfolio, and so on, until the end of our data series on 4/30/2014. When there were no securities available with positive net potential returns (usually, because hedging costs were too high), the last portfolio ending dollar amount was held as cash until the start of the next hedged portfolio. During those periods, we treated the cash as if it were held in a non-interest bearing account, so the dollar amount invested remains constant until the start of the next hedged portfolio. Within hedged portfolios, residual cash positions were treated as if they were invested in a money market fund, earning the yield prevailing at the time (during much of this time period, that yield was negligible). Within hedged portfolios, positions in underlying securities were entered at their unadjusted closing prices, with trading commissions of $7.95 deducted. To facilitate performance tracking, the dollar amounts allocated to these underlying securities were converted to the equivalent numbers of each security at its adjusted closing price on the start date of the portfolio. Underlying security positions were exited at their adjusted closing prices, with trading commissions of $7.95 deducted. During the simulation, to be conservative, puts were purchased at the closing ask price, and calls were sold at the closing bid price; options were exited at the midpoint of the closing bid-ask spread or their intrinsic value, whichever was higher (“last” prices weren’t used because in many cases with options, the last price might be weeks old). Each time options positions were entered or exited, a trading fee of $7.95 + $0.75 per option contract was deducted (the trading fees were the ones charged by Fidelity at the time). Results of the Hedged Portfolio Backtests In general, the higher the threshold was, the higher the CAGR was. CAGRs ranged from 3.26% at a 2% threshold, to 11.06% at a 22% threshold. Results at those thresholds and three other thresholds in between, and interactive graphs showing hedged portfolio holdings at each threshold during the backtesting period, can be found at this link . Disclosure: I/we have no positions in any stocks mentioned, and no plans to initiate any positions within the next 72 hours. (More…) I wrote this article myself, and it expresses my own opinions. I am not receiving compensation for it (other than from Seeking Alpha). I have no business relationship with any company whose stock is mentioned in this article.