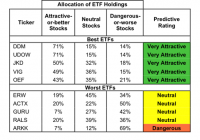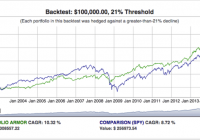
The hedged portfolio method enables investors to precisely specify and strictly limit their risk. From 1/2/2003 to 4/30/2014, net of trading fees and hedging costs, the hedged portfolio method generated a CAGR as high as 11.06% versus 8.72% for SPY. The security selection method generated alpha using price history and options market sentiment. The backtests uncovered interesting relationships between hedging methods, costs, and security returns. The Hedged Portfolio Method The goal of the hedged portfolio method is to generate competitive returns for an investor while strictly limiting his risk. For example, an investor unwilling to risk more than a 10% drawdown over the next six months (i.e., an investor whose “threshold” was 10%) could invest in a hedged portfolio structured to maximize his expected return while insuring that, in the worst case scenario (each of his underlying securities going to zero), his portfolio would decline no more than 10% over that time period. Our backtests determined that the hedged portfolio method can achieve competitive returns while strictly limiting risk. Below, for example, is a chart showing the performance of a series of 21% threshold hedged portfolios from 1/2/2003 to 4/30/2014, versus the performance of SPY over the same period. (click to enlarge) How It Works In broad strokes, this is the process for creating a hedged portfolio: Calculate a potential return for every hedgeable security in your universe (the Portfolio Armor universe consists of the 3,000+ hedgeable stocks and exchange traded products traded in the U.S.). Calculate the cost of optimally hedging each security. Subtract 2. from 1. to get potential returns net of hedging costs, or net potential returns. Rank the securities in order of their net potential returns. Pick a handful of the securities with the highest net potential returns to populate a concentrated portfolio and hedge them according to the investor’s risk tolerance. There are a few additional steps we employ to minimize cash levels and maximize potential returns, but that’s the basic idea. Here is an example of what a hedged portfolio looks like. That one was created on August 11th, 2015, and was designed for an investor who wanted to invest $1,000,000 while limiting his downside risk to a drawdown of no more than 18% over the next six months. That portfolio includes the stocks with highest potential returns in Portfolio Armor’s universe as of that date: Amazon, Inc. (NASDAQ: AMZN ), Expedia, Inc. (NASDAQ: EXPE ), Mondelez (NASDAQ: MDLZ ), Norwegian Cruise Line Holdings (NASDAQ: NCLH ), Netflix, Inc. (NASDAQ: NFLX ), Regeneron Pharmaceuticals (NASDAQ: REGN ), and Tyler Technologies (NYSE: TYL ). It’s clear that the first step in creating a hedged portfolio, calculating potential returns, is crucial, for two reasons: first, if you can’t select securities with the potential to generate alpha, your hedged portfolio returns will lag; second, in order to know if it’s worth the cost of hedging the securities, you need to have an idea of how accurate your potential returns are. So, before backtesting the hedged portfolio method as a whole, first we backtested our security selection method. Backtesting Our Security Selection Method Every trading day, Portfolio Armor generates high-end estimates of how more than 3,000 stocks and exchange traded products will perform over approximately the next six months. These estimates are based on analysis of historical returns as well as option market sentiment (determined by the cost of hedging each security in various ways), which provides a forward-looking element. We call this high-end estimate a security’s potential return. Essentially, it’s how the security might perform over the next six months in a bullish scenario. We backtested this method by running our analysis every trading day from 1/2/2003 to 10/31/2013 and then looking at the actual returns of the securities with the highest potential returns on our daily scans over the next six months. Over that 11-year period, we conducted 25,412 comparisons of our calculated potential returns to actual returns, an average of 9.4 top-ranked securities each trading day. The average potential return we calculated was 22.4%. The average actual return over the next six months, unhedged, was 6.84%. Since the average actual return was 0.3x the average potential return, we use that 0.3x multiple to derive expected returns from our potential returns. While a potential return represents a bullish upside, an expected return is the more likely result. A subset of our top-ranked securities – 5,202 of them, or about 20% of them – had an even higher average actual return: 9.35%. All of our top-ranked securities were hedgeable with optimal collars, but the securities in this subset were also hedgeable with optimal puts (we call these AHP securities, for short). There aren’t always AHP securities available, but when there are, our portfolio construction algorithm gives preference to them proportional to their higher average returns in our tests. Specifically, we increase their potential returns by 37%, since 9.35% is 1.37x 6.84%. The security returns mentioned above were unhedged; we also tested gross returns (i.e., not net of hedging costs) of our security selection method while hedging against greater-than-9% declines. When doing so with optimal puts, the average gross return was 12.08% over six months. The average gross return for the same securities when hedged with optimal collars capped at their potential returns was about half as much, 6.25%. This illustrates to what extent the average actual returns of the securities hedged with optimal puts were driven by outliers – securities that appreciated beyond our calculated potential returns. We adjust for the impact of potential outliers during the portfolio construction process, by only hedging with optimal collars when the net potential return is greater than 1.93x that of the same security when hedged with an optimal put (since 12.08/6.25 = 1.93). Backtesting The Hedged Portfolio Method To backtest the hedged portfolio method, we started searching for a hedged portfolio at each threshold on 1/2/2003. Hedged portfolios were run for six months, or until all positions had been exited, whichever came first, and then the ending dollar amount of the first portfolio was used as the starting dollar amount of the second sequential portfolio, and so on, until the end of our data series on 4/30/2014. When there were no securities available with positive net potential returns (usually, because hedging costs were too high), the last portfolio ending dollar amount was held as cash until the start of the next hedged portfolio. During those periods, we treated the cash as if it were held in a non-interest bearing account, so the dollar amount invested remains constant until the start of the next hedged portfolio. Within hedged portfolios, residual cash positions were treated as if they were invested in a money market fund, earning the yield prevailing at the time (during much of this time period, that yield was negligible). Within hedged portfolios, positions in underlying securities were entered at their unadjusted closing prices, with trading commissions of $7.95 deducted. To facilitate performance tracking, the dollar amounts allocated to these underlying securities were converted to the equivalent numbers of each security at its adjusted closing price on the start date of the portfolio. Underlying security positions were exited at their adjusted closing prices, with trading commissions of $7.95 deducted. During the simulation, to be conservative, puts were purchased at the closing ask price, and calls were sold at the closing bid price; options were exited at the midpoint of the closing bid-ask spread or their intrinsic value, whichever was higher (“last” prices weren’t used because in many cases with options, the last price might be weeks old). Each time options positions were entered or exited, a trading fee of $7.95 + $0.75 per option contract was deducted (the trading fees were the ones charged by Fidelity at the time). Results of the Hedged Portfolio Backtests In general, the higher the threshold was, the higher the CAGR was. CAGRs ranged from 3.26% at a 2% threshold, to 11.06% at a 22% threshold. Results at those thresholds and three other thresholds in between, and interactive graphs showing hedged portfolio holdings at each threshold during the backtesting period, can be found at this link . Disclosure: I/we have no positions in any stocks mentioned, and no plans to initiate any positions within the next 72 hours. (More…) I wrote this article myself, and it expresses my own opinions. I am not receiving compensation for it (other than from Seeking Alpha). I have no business relationship with any company whose stock is mentioned in this article.