Tag Archives: alternative

SCHX: It’s Like SPY With Lower Expense Ratios
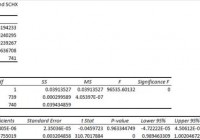
Summary I’m taking a look at SCHX as a candidate for inclusion in my ETF portfolio. SCHX looks incredible in my initial review. The ETF has slightly better diversification than SPY, but similar overall risk. I expect SCHX to be a core part of my new portfolio. I’m not assessing any tax impacts. Investors should check their own situation for tax exposure. Investors should be seeking to improve their risk-adjusted returns. I’m a big fan of using ETFs to achieve the risk adjusted returns relative to the portfolios that a normal investor can generate for themselves after trading costs. I’m working on building a new portfolio and I’m going to be analyzing several of the ETFs that I am considering for my personal portfolio. One of the funds that I’m considering is the Schwab U.S. Large-Cap ETF (NYSEARCA: SCHX ). I’ll be performing a substantial portion of my analysis along the lines of modern portfolio theory, so my goal is to find ways to minimize costs while achieving diversification to reduce my risk level. What does SCHX do? SCHX attempts to track the total return of the Dow Jones U.S. Large-Cap Total Stock Market Index. At least 90% of funds are invested in companies that are part of the index. SCHX falls under the category of “Large Blend”. Does SCHX provide diversification benefits to a portfolio? Each investor may hold a different portfolio, but I use (NYSEARCA: SPY ) as the basis for my analysis. I believe SPY, or another large cap U.S. fund with similar properties, represents the reasonable first step for many investors designing an ETF portfolio. Therefore, I start my diversification analysis by seeing how it works with SPY. I start with an ANOVA table: (click to enlarge) The correlation is over 99%. In short, no benefits should be expected from combining the ETF with SPY. That’s fine; the holdings are largely the same as SPY. SCHX is a replacement ETF for SPY, not a complementary holding. Standard deviation of daily returns (dividend adjusted, measured since January 2012) The standard deviation is higher. For SCHX it is .7303%. For SPY, it is 0.7300% over the same period. SPY usually beats other ETFs in this regard, and the difference between the two is largely meaningless. Because the two funds have extremely high correlation and almost identical risk profiles, the most important part of the comparison will probably be the expense ratios. Allocation I believe a fund like SPY or SCHX should be a core holding in most portfolios. Therefore, I think a reasonable level of exposure ranges from 10% to 35%. The largest exposure I would want to consider would be around 50%. In my opinion, by the time exposure levels get that high, there are other investments that can be mixed in to lower the total risk of the portfolio without hurting the expected returns. Why I use standard deviation of daily returns I don’t believe historical returns have predictive power for future returns, but I do believe historical values for standard deviations of returns relative to other ETFs have some predictive power on future risks and correlations. Under standard deviation of daily returns, the S&P 500 is remarkably efficient in long-term growth relative to volatility. Yield & Taxes The distribution yield is 1.70%. The SEC yield is 1.78%. Based on the yields, I think the ETF is solid as a part of a portfolio for retirees. If I were retiring, I would want to lower my position in SPY or SCHX in favor of putting more of the portfolio into slightly higher yielding value companies. However, I still think an exposure around 10% would be both reasonable and prudent in many scenarios. It’s difficult to build a portfolio near the efficient frontier, in my opinion, without including an ETF that tracks large U.S. companies. Because I have a long ways to go to reach retirement, I want an exposure in the 15 to 30% range. I’m not a CPA or CFP, so I’m not assessing any tax impacts. Expense Ratio The ETF is posting .04% for an expense ratio. I want diversification, I want stability, and I don’t want to pay for them. The .04% expense ratio makes me happy as an investor. SPY appears to have around .09% for an expense ratio. The ratio for SPY is actually closer to .094%, but it is regularly rounded down when screening. Market to NAV The ETF is at a .06% premium to NAV currently. It is trading pretty close to NAV, but in the interest of risk-adjusted returns I really like to know that I’m buying it right on or just below NAV. Premiums or discounts to NAV can change very quickly so investors should check prior to putting in an order. Largest Holdings The portfolio has solid diversification. SPY is holding a very similar portfolio but with a slightly larger allocation to the top companies, such as 3.55% in Apple (NASDAQ: AAPL ). However, the additional diversification for SCHX can be partially set off by some of the companies near the top being less volatile or by the ETF having less trading volume. (click to enlarge) Conclusion I’m currently screening a large volume of ETFs for my own portfolio. The portfolio I’m building is through Schwab, so I’m able to trade SCHX with no commissions. I have a strong preference for researching ETFs that are free to trade in my account, so most of my research will be on ETFs that fall under the “ETF OneSource” program. SCHX is a very strong contender to be a core holding in the new portfolio. I wanted a replacement for SPY that I would be able to trade without commissions. Of course, I also wanted to see a lower expense ratio, and SCHX delivered that. When I transfer money into this new portfolio (probably in February), I expect that SCHX will be allocated 15 to 30% of my portfolio value. I am not compensated by Schwab in any way for writing about ETFs that fall under their program. I select several ETFs under their program because I am doing research for my own investing and want to avoid trading fees. Additional disclosure: Information in this article represents the opinion of the analyst. All statements are represented as opinions, rather than facts, and should not be construed as advice to buy or sell a security. Ratings of “outperform” and “underperform” reflect the analyst’s estimation of a divergence between the market value for a security and the price that would be appropriate given the potential for risks and returns relative to other securities. The analyst does not know your particular objectives for returns or constraints upon investing. All investors are encouraged to do their own research before making any investment decision. Information is regularly obtained from Yahoo Finance, Google Finance, and SEC Database. If Yahoo, Google, or the SEC database contained faulty or old information it could be incorporated into my analysis. The analyst holds a diversified portfolio including mutual funds or index funds which may include a small long exposure to the stock.
Investing Is Not Gambling, Part 2

Summary Recap on Part 1: top short idea (AYA CN) has paid off. Part 2 introduces more ways to play the responsible investing theme. See below for blended strategy and a more conservative fixed-income strategy in a world of record-setting equity markets. Recap on Part 1 Socially responsible investing is becoming a mainstream phenomenon. Just this week, CNBC caught wind of it and featured the slumping of sin stocks, As a recap of Investing is Not Gambling, Part 1 , AYA CN was featured as the most overvalued gambling stock in the note. Since Part 1 was published, AYA stock has underperformed the SPTSX index: AYA slumped 20+% while the index finished the year essentially flat. Source: Bloomberg In this article, Part 2, I will introduce more ways to play the social responsibility theme. More ways to play this strategy I. Equity-Fixed Income Blended Strategy A Bloomberg screen returns over 130 mutual funds that either exclude or restrict gambling related investments. Strategies of these funds range from equities to bonds, and from balanced to international. To be clear, the exclusion/restriction is not a simple black-and-white rule. If you read the prospectuses (which you should), sophisticated fund managers conduct in-depth analysis . If the overall social impact and financial returns outweigh the profit contribution from gambling products, the security may be retained in the portfolio. For example, if an innovative machine manufacturer derives 5% of its profit from slot machines and the rest from carbon control devices, its securities may well be included. If you are leery about excessive exposure to equities (at near-record level one has sufficient reasons to think so), you should look for blended strategy among the 130 or so funds. When selecting funds, investors should pay attention to their different benchmarks. The highest returning fund may not be the best investment just because it has the most aggressive strategy (i.e. higher allocation to equities). With that in mind, I have laid out funds with blended strategy and grouped them by benchmarks. They are then ranked by equity exposure. As shown in the chart below, PWMAX , PWMCX , and PWMIX all are compared against a benchmark with only 24% equity exposure and, not surprisingly, have the lowest returns. The equity weight then goes up to 42% for PMPAX, PWPCX, and PWPIX; it rises to 55% for PGPAX and PMMIIX; and it finally reaches 60% for CBAIX, CSGCX, and WSBFX. Next, comparing fund returns against their respective benchmark, one will get a real picture of each fund’s alpha. It turns out, PWMIX has the highest alpha and the third lowest management fees. For investors with a higher risk appetite, PGPAX and PMIIX offer a good compromise between aggressiveness and alpha. Chart: fund returns Source: Bloomberg II. Fixed Income Focus Strategy Again, if you are bearish on the equity market in 2015, excluding funds with equity exposure, you can still choose from 50-odd funds. Following a similar selection process as above, investors will see that Praxis Genesis Conservative Strategy Fund (MUTF: MCONX ) offers outstanding risk-adjusted returns with a management fee of only 0.05%. Last but not the least, for the purists out there, MCONX strictly excludes any security related to the gambling industry. One thing I did not explore so far is project-based investments, such as the Social Impact Bonds pilot program in the UK. Institutional investors such as high-net worth individuals and foundations are invited to either guarantee first loss or lend capital into the program. Such projects are usually off limit to retail investors. However, I am all ears if you know of projects accessible to all.

10.6% Yielding ETW Offers Both Income And A Capital Appreciation Opportunity

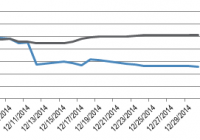
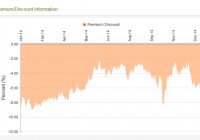
Summary ETW is a global option-income fund that uses a covered call strategy to deliver a 10.6% yield. High-volume selling of ETW has dropped its discount to a level not seen in the last 18 months. Buying ETW today locks in a higher yield and also provides the opportunity for capital appreciation if the discount reverts back to its historical average. Introduction Eaton Vance Tax Managed Global Buy Write Opportunities Fund (NYSE: ETW ) is an option-income close-ended fund [CEF] from Eaton Vance (NYSE: EV ). Thi s fund seeks t o achieve “current income with capital appreciation through investment in global common stock and through utilizing a covered call and options strategy.” ETW currently sports a -10.3% discount and a 10.6% market yield. This yield is generated by maintaining a long exposure to common stocks, while writing call options against the underlying indices. ETW is a global fund which benchmarks itself against a composite of 33% S&P 500, 22% NASDAQ 100, 34% FTSE E100 and 11% Nikkei 225. According to data supplied by Eaton Vance , ETW writes index call options on 94% of its portfolio, with an average of 15 days to expiration, and at 1.6% out of the money. Therefore, ETW can be considered to be a relatively defensive option-income fund. The covered call strategy generates a high level of current income, but caps the upside potential of the fund. This is because the maximum upside of a call option is equal to the strike price of the option plus the premium received. Hence, equity option-income funds are expected to lag the market index in a rising market. On the other hand, option-income funds will likely outperform in sideways or declining markets, which, given the tremendous performance of the U.S. stock market over the past few years, could very well be in store for us in 2015. Additionally, the 10.6% yield is highly attractive to investors seeking decent income from their equity holdings. In a previous article in June 2014, we noted that ETW’s discount of -3.3% was much higher than its 52-week average of -7.7%, while the -8.45% discount of Eaton Vance Tax-Managed Global Diversified Equity Income Fund (NYSE: EXG ) discount was similar to its 52-week average of -8.33%. Given the similar investment mandates of the two funds, the article recommended to sell ETW and buy EXG to take advantage of mean reversion in CEFs. Six weeks later , the discount for ETW had widened from -3.31% to -3.93% while the discount for EXG had narrowed from -8.45% to -5.60%. Hence, this pairs trade was up more than 2.6% in 6 weeks (~23% annualized). Taking advantage of mean reversion in CEFs is a potential strategy o obtain outsized profits. In a July 2014 paper entitled Exploiting Closed-End Fund Discounts: The Market May Be Much More Inefficient Than You Thought , authors Patro, Piccotti and Wu provide significant evidence of mean reversion in closed-end fund premiums. This article identifies an opportunity to buy ETW at a greater discount than its 1-year average. Widening discount The graph below is from CEFConnect and shows the premium/discount value of ETW over the past year. (click to enlarge) The table below shows the current, average 1-year, 3-year and 5-year discount values of ETW (source: CEFConnect). Time Discount 1-year -5.32% 3-year -9.43% 5-year -4.18% Current -10.33% We can see from the data above that ETW’s discount is lower its average discount over all three time periods. According to CEFAnalyzer , the 1Y Z-score for ETW is -1.71, indicating that the current discount of ETW is significantly below its 1Y average discount (adjusted for standard deviation). The 2Y and 4Y Z-scores are -0.48 and 0.37, respectively. What was the reason for this relatively large discount? One culprit may have been the high-volume selling of the fund on the final few trading days of last year. Over 956K shares changed hands in the last four days of 2014 (avg. daily volume = 400K), with the final day’s volume of 1.6M exceeding the volume of any other trading day in 2014. Over the course of those four days, ETW dropped 6.1%, compared to 1.1% for the U.S. stock market (NYSEARCA: SPY ) and 1.4% for the global stock market (NASDAQ: ACWI ). (click to enlarge) However, remember that the market price of a close-ended fund has no relationship to its net asset value. Therefore, the decline in share price of ETW caused by the high-volume selling of the fund over the past couple of days is the equivalent of sweaters going on sale after the holiday: you get the exact same product but at a lower price. The graph below was generated using data from Yahoo . We can see that the yield currently offered by ETW is higher than at any other time point in 2014. Based on the above analysis, I purchased ETW today at a price of $11.23 Buying thesis Lock in a high current yield of 10.6% while being exposed to some upside of the global stock market. Outperform the underlying index in a flat or declining market. Capital appreciation if the current discount of -10.33% narrows back to its average. Risks The discount may widen further. In late 2011, the discount widened to over 15%. The fund will underperform in a strong bull market. Loss of capital in a declining market (albeit with some downside protection due to the call premiums received).