Tag Archives: alternative

5 Ways To Play Rising Rates With Hedged And Inverse ETFs

The recent U.S. labor market data yet again corroborated the sturdy U.S. economic growth. While weak wage growth has been bothering the investing world for quite some time, a better than expected average hourly earnings data finally wiped out investors’ fears. In this backdrop, most have started speculating a sooner than expected hike in the Fed interest rates, which have been at a rock-bottom level for long. Yields on 10-year Treasury notes crossed the 2% mark on February 10 for the first time after January 8, 2015. Fixed-income investing had enjoyed a great show in 2014 and so far in 2015, especially in the longer part of the yield curve. However, the prospect of rising rates and risks to capital gains of the bond holdings have left investors jittery about the safety of their portfolios and brought rate rise worries back on the table. Given the situation, many investors are definitely pulling their money out of the bond market. At a time like this when investors are extremely cautious about rising rate risks and stock market volatility, investments in U.S. bonds with significant protection against potential rising rates can be good bets. Some opportunistic investors could capitalize on this backdrop in the form of inverse ETFs too (read: Two Interest Rate Hedged ETF Launches from iShares ). iShares Interest Rate Hedged High Yield Bond ETF (NYSEARCA: HYGH ) This fund holds in its basket iShares iBoxx $ High Yield Corporate Bond ETF (NYSEARCA: HYG ) while taking short positions in U.S. Treasury futures to diminish rising rate concerns. HYGH has a weighted average maturity of 4.60 years while its effective duration stays ultra-low at 0.32 years. HYGH is high yield in nature as evident from its 30-day SEC yield of 5.47%. HYGH charges 0.55% of expense ratio. The fund has added about 2% in the last five trading sessions (as of February 10, 2015) (see all the junk bond ETFs here). ProShares High Yield Interest Rate Hedged ETF (BATS: HYHG ) HYHG is another ETF, which has an interest rate hedge built into its strategy as it takes a short position in U.S. Treasury futures. Like HYGH, it also has a pretty high yield (and a modest expense ratio of just 50 basis points) of 5.9% in 30-Day SEC terms, indicating that this could be a safer bond and yield play for investors anxious about the possibility of rising rates. This $125.4 million ETF was up 1.9% in the last five trading sessions (as of February 10, 2015) (read: 5 Dividend ETFs to Buy for Income in 2015 ). ProShares Investment Grade-Interest Rate Hedged ETF (BATS: IGHG ) This investment grade fund too offers interest-hedge benefit to investors. The fund looks to track the Citi Corporate Investment Grade (Treasury Rate-Hedged) Index, which comprises long positions in USD-denominated investment grade corporate bonds issued by both U.S. & foreign domiciled companies while adopting short positions in US Treasury notes or bonds of approximate equivalent duration to the investment grade bonds. The index seeks to achieve an overall effective duration of zero. Its 30-Day SEC yield stands at 3.32% (as of February 10, 2015) while it charges 30 bps in annual fees. The fund was up 1.1% in the last five trading sessions (as of February 10, 2015). Barclays Inverse US Treasury Aggregate ETN (NASDAQ: TAPR ) The note provides investors a unique strategy to hedge against or benefit from the rising U.S. dollar interest rates by tracking the Barclays Inverse US Treasury Futures Aggregate Index. This benchmark employs a strategy, which follows the sum of the returns of the periodically rebalanced short positions in equal face values of each of the 2-year, 5-year, 10-year, long-bond and ultra-long U.S. Treasury futures contracts (read: Interest Rate Speculation: A Boon for TAPR ETF ). If the price of each Treasury futures contract increases or decreases by 1% of its face value, the value of the index would decrease or increase by 5% over the same period. The fund charges 43 bps in annual fees and trades in light volume of under 5,000 shares per day on average, ensuring additional cost in the form of a wide bid/ask spread. The fund has added about 16.6% in the last five trading sessions. iPath US Treasury 5-year Bear ETN (NASDAQ: DFVS ) The fund looks to track inverse movements in the yields from buying 5-year U.S. T-Notes. To do this, its underlying index tracks the returns of an investment in a weighted “short” position in relation to 5-year Treasury contracts. This $4.8 million ETF was up about 8.9% in the last five trading sessions. The fund charges 75 bps in fees. Bottom Line As a caveat, investors should note that these inverse products are suitable only for short-term traders as these are rebalanced on a daily basis (see: all the Inverse Bond ETFs here). Still, for ETF investors who are bearish on the bond market in the near term, any of the above products could make an interesting choice.
My Dividend Income Portfolio Update

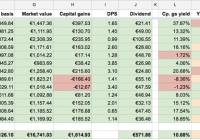
Six months ago , I decided to become a Dividend Growth Investor and become financially independent. Every month on the 8th and the 24th, I have invested €1000 in new stocks. If I keep this up, 15 years from now , my stock portfolio will grow large enough for me to be able to pay off all the monthly expenses with dividend income alone. On that day, my wife and I can retire. Today it’s February 16 . So how am I doing? Are we retired yet? Well, not yet. But my stock portfolio is doing very well. As of today, I am invested in 13 stocks with a market value of €16,741 . (click to enlarge) My portfolio is yielding a very healthy 14.46% (*) with a 3.78% yield on cost. The projected dividend for this year is €571.88, or €47.66 per month on average. (*) The total yield listed here is the sum of the capital gains yield and the yield on cost. This pretty much covers my gas bill, which is about €45 per month. So one way of looking at this income is to realize that for the entire year I will have free cooking and heating. Guess I don’t have to feel guilty about standing under the shower for more than 20 minutes. Let’s take a look at my last 3 purchases. Royal Dutch Shell (NYSE: RDS.A ) Shell caught my eye because of its high yield of 4.64% (one month ago) and low 13.8 P/E. It’s one of the cheaper high-yielding oil companies and provides me with a nice opportunity to raise the average dividend yield of my portfolio. Unfortunately, the dividend and earnings growth is not so good: respectively 2.21% and 4.56% . This is too low, as can be seen when calculating the Chowder number and Discount rate: respectively 6.49 (should be 12 or more) and 8.85 (should be 10 or more). Shell has a nice yield, but a very low dividend growth and not enough earnings growth to fund future dividend rises. So why go for this stock? I confess: I bought Shell partly out of nostalgia. My father worked at Shell for almost his entire career, and I have happy childhood memories of their bring your kids to work days at the KSLA building in Amsterdam. But another reason for buying Shell is that there is no indication that the company is in any kind of existential trouble. I take the long view and expect good results from this stock in the next 20-30 years, when worldwide oil reserves start to dry up. Oil prices will eventually rise again, Shell will flourish, and the company has a very good reputation of rewarding shareholders with dividend. I expect this stock to do fine. But it might take a few years. Philip Morris (NYSE: PM ) Now here is a stock with much better metrics. Philip Morris is the golden boy of many dividend growth investors right now. A 4.63% yield and a 17.29 P/E make this company an affordable high-yielder. But things get really interesting when looking at historic growth. PM has been growing its dividend at a healthy 18.38% (5-year CAGR), which contributes to an impressive Chowder value of 23.06 . But what about earnings? PM has got that covered too, with a 5-year EPS CAGR of 9.64% , which contributes to a discount rate of 14.32 . The DPR is 76.6% , which is in line with other tobacco companies. For example, British competitor BATS has a DPR of 74.3% . All metrics look good on this stock, and so I pulled the trigger and bought 14 shares. National Oilwell Varco (NYSE: NOV ) I bought NOV back in December at €55.90 per share, which gave me a dividend yield of 2.5%. One month later, the stock has dropped to a feeble €46.80. I lost 16% of my investment. Many people would panic at this point. Buying a stock and then seeing it drop in value is scary. You’re supposed to buy low and sell high, right? So when a stock drops after you buy, you need to get rid of it as quickly as possible, cut your losses, and try again. Actually, no. That’s a terrible strategy. At its new price, NOV has a yield of 3% , which is 0.5% higher than when I bought it. So if I buy more shares, the average yield of my NOV position actually rises to 2.75% , and I will receive €2.50 in extra dividend. This is called ‘averaging down’, and it is one of the golden rules of dividend growth investing. When the stock price drops, you buy more. Of course, this strategy fails completely if the company is going bust. So how are they doing? Well, fine actually. The 5-year DPS CAGR is an astounding 74.33% , and EPS growth a hefty 10.69% . This gives a Chowder value of 77.35 and a discount rate of 13.72 . And their DPR is only 23.50 , which is very low for an oil company. So there is more than enough earnings growth to finance NOV’s over the top dividend growth in the near future. In fact, my ranking formula places NOV just below Apple (NASDAQ: AAPL ). And remember, Apple has a 5-year dividend growth rate of 118.25% , which is just plain crazy. I don’t think you can go wrong with this stock. I bought 21 new shares. My portfolio today My portfolio today has a yield of 14.46% . The best-performing stock in my portfolio is Apple with a total yield of 39.97% . (click to enlarge) I rank my portfolio by ChowderDiscount (the sum of the Chowder number and the Discount value) and YDPR rank (which measures the spread between yield and payout ratio). My best ranking stock is Apple with a combined rank value of 2.61 . (click to enlarge) The market value of my portfolio today is €16,741 . (click to enlarge) My portfolio is well diversified over industry sectors, even though ‘Oil and gas’ is getting a bit large: I’m also diversified over three currencies. A good start, but it’s clear I need to buy more UK stock in the future:

Russian Bears, Ukrainian Beets, Battlestar Novorossiya

Two events are driving the global economy: the Russo-Ukrainian war and the collapse of oil. Both the EU and the Russian Federation want to maintain the global economic status quo at the expense of Ukrainian territorial loss. Portfolios should be robust to continued expansion as well as black swan events. Many of the naysayers of the new year 2015 are being proven wrong: there has been no significant market correction in U.S. equities – as Bill Gross of Janus Capital and others had foreseen for 2015 – and Europe is showing signs of slow growth, despite numerous bears claiming the opposite. Timing is notoriously difficult and self-fulfilling with doomsday prophecies. I argue that there are two factors that any portfolio must be robust to, and each of these possesses its own positive or negative drag on the global economic environment: Russia and oil. Vladimir Putin of Russia could start World War III within seconds if he so desired, but he knows the country’s economy simply isn’t ready. Russia’s activity in Eastern Ukraine and the Crimean peninsula has in one year established a new norm in geopolitics: an ebb and flow between Russian aggression and Western appeasement, both of which are understandable from each side’s perspective. President Putin will not accept a loss in Eastern Ukraine because it is antithetical to his ideology that Russia is both under attack from the West and simultaneously superior to it . In comparison, Francois Hollande of France and Angela Merkel of Germany know that any escalation of the Russo-Ukrainian conflict could trigger open war and disrupt the EU’s fledgling recovery – German GDP rose 0.7% in the 4th quarter , after growing 0.1% in the previous 3 months. There is little confidence on Wall Street that the Minsk II agreements signed on February 11th will lead to prolonged peace, as the DJIA surged 72 points after the Minsk Protocol in September 2014 and decreased by 3 points after Minsk II and the German GDP surprise. The other looming fundamental driver is the price of oil. The market seems to lag when oil falls and prosper when oil increases. After flirting with the technically significant price of $43 per barrel, oil markets rallied on substantial CapEx cuts in the industry. However, there is no surety that oil will not plunge into the $30s this year. As Tom Kloza of Oil Price Information iterates , oil prices will bottom in Q2 corresponding with “one of the expirations of the WTI contracts.” The International Energy Agency explained that “ample supplies will raise global inventories before investment cuts begin to significantly dent production.” Combined with the astronomical impact of low oil prices on Russia’s budget, there is reason to suspect that the US is saving oil manipulation as a last economic tactic against further Russian aggression. The question is, which black swan event will happen first – open war in Ukraine or a collapse in oil? U.S. bond and equity markets are rallying despite mediocre economic fundamentals, because the U.S. is the only place to invest globally. Not that the U.S. is a powerhouse of growth and prosperity – it is, relatively, the only space where investors can earn better-than-index returns with a reasonable amount of risk. US Treasury yields are at record lows, because the dollar is strong and the U.S. Treasury is the only entity in the world that investors still believe has zero default probability. U.S. equities continue to trade at unusually high levels for two reasons: first, capital has poured into U.S. equities in search of higher returns in the low interest rate environment, fueling a sustained rally in the stock market (barring the “correction that wasn’t” that took place in October 2014); second, U.S. companies are taking advantage of low interest rates to lever returns at debt ratios not seen since before the collapse in 2008. A collapse in oil could be the catalyst that brings the U.S. equity market down to earth, especially given the heavy interdependencies between Western and Russian corporations. As long as the status quo remains the same and a black swan event doesn’t occur, this bubble may actually last and transition into a normal economic growth cycle. But that’s the catch – can the status quo be maintained? Expect Russian aggression and a collapse in oil to be inevitably linked. If one happens, so will the other. In this scenario, a portfolio overweight with U.S. treasuries and municipal bonds is ideal, with significant cash on hand to buy U.S. equities in the oil space on the dip. The status quo survives if Eastern Ukraine turns into a frozen conflict on the likes of Transnistria and Abkhazia as the U.S. and eurozone transition out of recovery into expansion. In this case, a portfolio overweight in cyclicals is ideal. Each scenario seems equally likely, so a risk-parity portfolio robust to both cases might be the best option. Unfortunately, neither the Ukrainians nor the Russians appear willing to concede territory at any cost, so look here to history for the consequences of inaction. Appealing to the words of Winston Churchill, “An appeaser is one who feeds a crocodile, hoping it will eat him last.” Disclosure: The author has no positions in any stocks mentioned, and no plans to initiate any positions within the next 72 hours. (More…) The author wrote this article themselves, and it expresses their own opinions. The author is not receiving compensation for it (other than from Seeking Alpha). The author has no business relationship with any company whose stock is mentioned in this article.