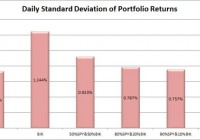
Summary The top 7 holdings are all Chinese, despite the ETF being labeled as diversified emerging markets. The standard deviation is pretty high and makes it difficult to try to use the ETF to lower risk across the total portfolio. On the positive side, the correlation is fairly low and the liquidity was solid which makes the statistics more reliable. I like investing in ETFs, and one of the ETFs I was looking at recently is the SPDR S&P BRIC 40 ETF (NYSEARCA: BIK ). It tracks the S&P BRIC 40 Index, and allocates at least 80% of the funds to the assets in the index. The Morningstar Category is “Diversified Emerging Markets”. However, after looking into it for a while I felt like it would be more representative to say the ETF is heavily invested in China. 67% of the ETF’s investments are in China. The only other markets included are Brazil, India, and Russia. I believe there are two methods for investing. Either you should know more than the other people performing analysis so you can make better decisions, or use extensive diversification and math to outperform most investors. Under CAPM (Capital Asset Pricing Model), it is assumed every investor would hold the same optimal portfolio and combine it with the risk free asset to reach their preferred spot on the risk and return curve. Do you know anyone that is holding the exact same portfolio you are? I don’t know of anyone else with exactly my exposure, though I do believe there are some investors that are holding nothing but the SPDR S&P 500 Trust ETF (NYSEARCA: SPY ). In general, I believe most investors hold a portfolio that has dramatically more risk than required to reach their expected (under economics, disregarding their personal expectations) level of returns. In my opinion, every rational investor should be seeking the optimal combination of risk and reward. For any given level of expected reward, there is no economically justifiable reason to take on more risk than is required. However, risk and return can be difficult to explain. I’ve been approximating risk by using the standard deviation of daily returns. Yields BIK has a 3.45% Distribution Yield and 2.65% SEC Yield. I believe a portfolio with a stronger yield is superior to one with a weaker yield if the expected total return and risk is the same. I like strong yields on portfolios because it protects investors from human error. One of the greatest risks to an otherwise intelligent investor is being caught up in the mood of the market and selling low or buying high. When an investor has to manually manage their portfolio, they are putting themselves in the dangerous situation of responding to sensationalistic stories. I believe this is especially true for retiring investors that need money to live on. By having a strong yield on the portfolio it is possible for investors to live off the income as needed without selling any security. This makes it much easier to stick to an intelligently designed plan rather than allowing emotions to dictate poor choices. In the recent crash, investors that sold at the bottom suffered dramatic losses and missed out on substantial gains. Investors that were simply taking the yield on their portfolio were just fine. Investors with automatic rebalancing and an intelligent asset allocation plan were in place to make some attractive gains. Expense Ratios The expense ratio for BIK is .50% for both gross and net expense ratios. Some analysts are heavily opposed to focusing on expense ratios. I don’t think investors should make decisions simply on the expense ratio, but the economic research I have covered supports the premise that overall higher expense ratios within a given category do not result in higher returns and may correlate to lower returns. The required level of statistical proof is fairly significant to determine if the higher ratios are actually causing lower returns. I believe the underlying assets, and thus Net Asset Value, should drive the price of the ETF. However, attempting to predict the price movements of every stock within an ETF would be a very difficult and time consuming job. By the time we want to compare several ETFs, one full time analyst would be unable to adequately cover every company. On the other hand, the expense ratio is the only thing I believe investors can truly be certain of prior to buying the ETF. I ran some historical numbers on the ETF and compared them to SPY to get a feel for how volatile the ETF was. My starting point was January 2012 and I ran the comparisons over a 3 year sample period. (click to enlarge) The portfolio had a 72.12% correlation to SPY when using daily values, which suggests a fairly significant connection. However, while SPY moved up substantially during the 3 year period, BIK had a fairly weak total return of only a few percentage points. In my opinion, it’s reasonable to think the daily correlation just reflects large amounts of money pouring in and out of the market. The returns over a long time period seem to be substantially less correlated to SPY. While SPY had a total return of 71.4% during that three year period, BIK returned only 4.95%. The liquidity looks solid with around 90,000 shares per day changing hands and 0 days in the last 3 years where the trading volume was 0. What are the holdings? Investors should at least glance at the holdings, even if they intend to buy an ETF on the premise that markets are efficient. By looking at the individual holdings the investors can check if the ETF will have a substantial overlap with other positions that they hold. In the case of BIK, investors should be aware of potential overlap with any other large holdings they have in China. (click to enlarge) Tencent Holdings Ltd. ( OTCPK:TCEHY ) is a Chinese investment holding company and Baidu Inc. ADR (NASDAQ: BIDU ) is a Chinese-language internet search provider. Outside of those 2, everything in the top 6 has China in its name. I assume most people are familiar with Alibaba (NYSE: BABA ). The first holding that isn’t in China is the 8th holding on the list. Conclusion BIK is an interesting ETF. At first it seems like it would be heavily diversified, but China is a fairly major position within the ETF. Therefore, when I am comparing BIK I may focus on comparing it to other Chinese focused ETF as much as I compare to other broadly diversified international ETFs. The standard deviation is very high, but I expect that for emerging markets. The total return for the sample period is quite sad, but the intent of diversification is to ensure a larger sample size that can reduce the overall level of deviations. However, the ETF does have fairly solid liquidity represented in both the average trading volume and the lack of days with shares changing hands. The yields are strong, which is a slight positive, but with the volatility of the ETF a retiring investor using it for yield would still be increasing the volatility of their portfolio. It’s a difficult call on which way to go in that regard and each investor would have to look at their personal tolerances. The ETF was at a significant premium to NAV when I looked. The expense ratio is not unreasonable for the exposure (emerging markets), but it did surprise that the emerging markets included so many major positions related to China. Disclosure: The author has no positions in any stocks mentioned, and no plans to initiate any positions within the next 72 hours. (More…) The author wrote this article themselves, and it expresses their own opinions. The author is not receiving compensation for it (other than from Seeking Alpha). The author has no business relationship with any company whose stock is mentioned in this article. Additional disclosure: Information in this article represents the opinion of the analyst. All statements are represented as opinions, rather than facts, and should not be construed as advice to buy or sell a security. Ratings of “outperform” and “underperform” reflect the analyst’s estimation of a divergence between the market value for a security and the price that would be appropriate given the potential for risks and returns relative to other securities. The analyst does not know your particular objectives for returns or constraints upon investing. All investors are encouraged to do their own research before making any investment decision. Information is regularly obtained from Yahoo Finance, Google Finance, and SEC Database. If Yahoo, Google, or the SEC database contained faulty or old information it could be incorporated into my analysis. The analyst holds a diversified portfolio including mutual funds or index funds which may include a small long exposure to the stock.