Tag Archives: alternative

Why Equity Outperforms Credit

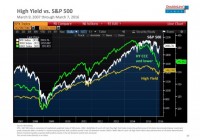
In my new paper on asset allocation I go into quite a bit of detail about why certain asset classes generate the returns they do. Understanding this is useful when thinking in a macro sense and trying to gauge why financial assets perform in certain ways in both the short-term and the long-term. It’s important to understand the fundamental drivers of these returns in order to avoid falling into the trap that these assets generate returns due to the way they’re traded in the markets. One of the more common misconceptions I see in the financial space is that credit traders are smarter than equity traders. This is usually presented with charts showing how credit “leads” equity performance or something like that. One of the more egregious offenders of this is a chart that has been going around in the last few days from Jeffrey Gundlach’s presentation showing credit relative to equity: One might look at this and conclude that these lines should necessarily converge at some point. As if the credit markets know something that the equity markets don’t. This is usually bandied about by bond traders who are convinced that stock traders are a bunch of dopes.¹ But this is silly when you think of things in aggregates because, in the long-run, the credit markets generate whatever the return is on the instruments that have been issued and not because bond traders are smarter or dumber than other people.² For instance, XYZ Corporate Bond paying 10% per year for 10 years doesn’t generate 10% for 10 years because bond traders are smart or stupid. It generates a 10% annualized return because the issuing entity pays that amount of income over the life of the bond. In fact, the more traders trade this bond the lower their real, real return will be. Trying to be overly clever about trading the bond, in the aggregate, only reduces the average return earned by its holders as taxes and fees chew into that 10% return. The “bond traders are smarter than stock traders” myth is hardly the most egregious myth at work here though. The bigger myth is the idea that equity must necessarily converge with credit over time. For instance, let’s change the time frame on our chart for a bit better perspective: If you’d bought into this notion that credit and equity converge starting in 1985 you would still be waiting for this great convergence. The reason for this is quite fundamental though. Corporate bonds only give owners access to a fixed rate of income expense paid by the issuing entity. Common stock, however, gives the owner access to the full potential profit in the long-term. If we think of common stock as a bond then common stock has essentially paid a 12% average annual coupon over the last 30 years while high yield bonds have only paid about a 8% coupon. In the most basic sense, credit and equity are different types of legal instruments giving the owner access to different potential streams of income. Equity, being the higher risk form of financing, will tend to reward its owners with higher returns over long periods of time. Why equity outperforms credit is hotly debated, but it makes sense that equity outperforms because the return on financing via equity must be higher than the potential return an investor will earn on otherwise safe assets. That is, if I am an entrepreneur who can earn 5% from a low risk bond it does not make sense for me to invest my capital in an instrument or entity that might not generate a greater return. In this sense, equity generates greater returns than credit because it’s not worth the extra risk to issue equity if the alternative is a relatively safe form of credit. Of course, it doesn’t always play out like this in the short-term, but if you think of equity as a sufficiently long-term instrument then it will tend to be true over the long-term because it’s the only rational reason for equity to be issued in the first place.³ ¹ – As an advocate of diversified indexing I can rightly be included as a “dope” about both asset classes. ² – This return could actually be lower due to defaults, callability, etc. ³ – “Long-term” in this instance has been calculated as at least a 25 year duration for equity. This is a sufficiently long period during which we should expect to see equity consistently earn a risk premium over credit.

Coal ETF On The Mend: Will The Momentum Last?

The dark days of coal suddenly lit up with coal ETF, the Market Vectors Coal ETF (NYSEARCA: KOL ), adding about 25% so far this year. In just the last one month, the fund advanced 27.5%, while it scooped up about 17% returns in the last five trading sessions (as of March 7, 2016). Investors should note that coal has long been a beaten-down commodity due to the growing popularity of the alternative energy space and soft global industry fundamentals. Global warming and high fuel emission issues as well as new and advanced technologies are making clean power more usable, curbing the demand for black diamond and hurting the profitability of coal producers. Notably, coal producer Peabody Energy Corporation (NYSE: BTU ) incurred losses in the last five quarters. Another coal miner, Arch Coal (NYSE: ACI ) filed for bankruptcy and was delisted from the stock market. What’s Behind the Shifting Wind? However, shares of coal-producing companies have lately been turning around. The renewed optimism in the oil patch may have acted as a jump pad for the entire energy sector. Plus, China’s intention to lay off about 20% workers in the coal industry to shift to a cleaner energy base led to a likely deceleration in supplies. Peabody too is aggressively implementing cost-saving initiatives, and has cut back on production and restructured its organization via lay-offs. The job cut will result in considerable cost savings every year. Peabody shares were up 82.3% in the last five trading sessions (as of March 7, 2016) Coming to CONSOL Energy Inc. (NYSE: CNX ), the rise in shares looks more sensible, as the company has been shifting its focus to natural gas from the more struggling coal space. This diversified energy producer is well placed to cash in on any pickup in commodity prices that we are witnessing at the current level. CNX was up 35.4% in the last five trading sessions (see all Energy ETFs here ). Having said all, the coal ETF is an amazing value play. Even after the recent spurt, KOL trades at a P/E (TTM) of 14 times, versus the Energy Select Sector SPDR ETF ‘s (NYSEARCA: XLE ) P/E (TTM) of 24 times. Quite understandably, investors do not want to lose out on any moment to make some quick gains out of this undervalued coal ETF. Can the Momentum be Sustained? The road ahead for these companies is anything but smooth, as the Clean Power Plan is sure to pose challenges. Not only in the U.S., the drive to lower carbon emissions and moderate the planet’s warming is rising globally. These have been thwarting the demand for coal in the U.S. The picture is almost the same in China. So forget being solid, the medium-term outlook for coal can easily be called soft. KOL in Focus Even then, the ETF targeting the global coal industry is making the most of the opportunity in its hand. KOL tracks the Market Vectors Global Coal Index. Holding 26 securities in its basket, the fund is concentrated on the top 10 holdings at about 60% of total assets. It has a Chinese focus accounting for 27% of the portfolio, while the U.S., Australia and Canada round off the next three spots with double-digit weights each. The fund has amassed $47.1 million in its asset base and trades in average daily volume of 71,000 shares. Its expense ratio comes in at 0.59%. KOL has a Zacks ETF Rank of 5 or “Strong Sell” rating with a High risk outlook. Original Post

The Best And Worst Of February: Managed Futures

Managed futures mutual funds and ETFs had a strong month in February, with the average fund in the group returning +1.77% while the S&P 500 Index dropped 0.13% and the Barclays US Aggregate Bond Index gained 0.71%. Most funds generated positive returns for the month, and the top three funds gained between 3.67% and 6.34%, while only two funds in the entire category lost more than 0.88% in February. Top Performers in February The three best-performing managed futures mutual funds in February were: The PIMCO TRENDS fund was the category’s top performer in February, gaining an impressive 6.34%. Unfortunately, the fund – which debuted on the last day of 2013 – was still down for the year ending February 29, with one-year returns of -2.93% ranking it in the bottom 37% of its category. The fund’s one-year beta, relative to the Credit Suisse Managed Futures Liquid Index, of 0.60 was roughly in line with the category average of 0.66, while its one-year alpha of -4.27% compared unfavorably with the category average of -2.60%. PQTAX’s one-year Sharpe ratio through February 29 was -0.23, compared to -0.01 for the category as a whole. The SFG Futures Strategy Fund ranked second among managed futures mutual funds and ETFs in terms of February performance, with monthly gains of 3.92%. But like the PIMCO TRENDS fund, SFG’s Futures Strategy underperformed for the year ending February 29, returning -3.93% and ranking in the bottom third of the category. Its one-year beta and alpha stood at 0.75 and -6.38%, respectively, giving it a Sharpe ratio of -0.37. Of February’s top-three performers, the Altegris Managed Futures Strategy looked best beyond the past month’s performance. Its February gains of 3.67% contributed to its one-year return of +4.75% through February 29, ranking in the top 20% of the category. The fund, which debuted in August 2010, had three-year annualized returns of +3.71%. Its one-year beta of 0.81 indicates a relatively high correlation with the Credit Suisse index, but its alpha of 2.21% and Sharpe ratio of 0.48 highlight its outperformance. Worst Performers in February The three worst-performing managed futures mutual funds in February were: Dunham’s Alternative Strategy Fund was February’s worst performer in the managed futures category, returning a dismal -3.25%. DNASX’s underperformance has been enduring, as its -11.92% one-year returns through February 29 ranked in the bottom 8% of the category. Its one-year beta of -0.20 indicates it has very low (modestly inverse) correlation to the Credit Suisse index, but this favorable feature is overshadowed by the fund’s -11.26% one-year alpha. Its one-year Sharpe ratio, a measure of risk-adjusted returns, stood at an abysmal -2.29. The First Trust Morningstar Managed Futures Strategy ETF was the only exchange-traded fund among the top or bottom three for February. It returned -1.22% for February and -3.97% for the year ending February 29. The fund had a beta of 0.39, alpha of -4.64%, and a one-year Sharpe ratio of -0.61. Finally, the Discretionary Managed Futures Strategy Fund was February’s third-worst performer in the category, returning -0.88% for the month. The fund’s one-year return of -1.90% ranked in the bottom 46% of funds in its category, and its beta of 0.03 ranked among the lowest in the category. The fund’s one-year alpha was -2.09%, indicating that it underperformed the index even as it remained mostly uncorrelated with it. In risk-adjusted terms, FUTEX’s returns resulted in a one-year Sharpe ratio of -1.09. Note : Alpha and Beta statistics are relative to the Credit Suisse Managed Futures Liquid Index. Past performance does not necessarily predict future results. The Jason Seagraves contributed to this article.