Tag Archives: alternative

Source Capital: Not The Time To Buy In An Up And Down Year

SOR is struggling so far in 2015. But it’s been an up and down year when comparing the first and second quarters. And the narrower than average discount suggests now isn’t the time to jump aboard. Source Capital (NYSE: SOR ) is an old hand in the closed-end fund, or CEF, space, having been in business since 1968 . It’s long used a focused portfolio to opportunistically invest in small- and mid-cap companies with high returns on equity. That’s great, but a narrower discount than normal of late suggests new investors would be better off waiting here. Here’s what’s been going on. What a difference a quarter makes According to SOR , its net asset value return was 3.1% in the first quarter. That was below its Russell 2500 benchmark, which was up over 5%, but well ahead of the S&P 500, which was up less than 1% in the first quarter. So it’s no surprise that investors would be generally pleased with the closed-end fund, or CEF. Indeed, during the first quarter, the market price of the shares went up along with the NAV. However, something changed in the second quarter. SOR’s NAV fell 2%, worse than the 0.3% or so loss for the Russell 2500 and the around 0.3% gain in the S&P. But while the NAV has been falling, investors haven’t reacted by selling the shares. In fact, they’ve pretty much been holding the line. With that backdrop, SOR’s discount, which has recently been averaging around 9% but has a three-year average of about 10%, has narrowed. The discount is recently hovering around 7% or so-roughly in line with its 10-year average according to the Closed-End Fund Association . Long-term investors should probably tread carefully here since the shares are clearly not on sale. Those looking to play discounts and premiums, meanwhile, should also be on the sidelines. What’s been going wrong? Obviously losing positions outweighed winners in the second quarter . More specifically, retailers Signet Jewelers (NYSE: SIG ) and CarMax (NYSE: KMX ) have been sagging and that’s a big problem. These two are the second and third largest holdings in the fund, making up about 15% of assets. CarMax is down nearly 6% this year and Signet over 8%. With a concentrated portfolio, big bets are the norm. And that’s something that investors in SOR need to fully understand. For example O’Reilly Automotive (NASDAQ: ORLY ), a winner for the fund so far this year, makes up nearly 15% of assets. Taking that a step further, the top three holdings make up about 30% of the fund. For reference, the top 10 holdings account for around 60% of the fund. So you can see the impact O’Reilly, Signet, and CarMax will have on performance. With two of the three struggling, it’s no surprise that SOR’s NAV is only slightly ahead of where it started the year. Adding to the negatives, at the start of the second quarter two other struggling companies were in the top 10, Knight Transportation (NYSE: KNX ) and Heartland Express (NASDAQ: HTLD ). Only Knight remained a top 10 holding at the end of the second quarter at roughly 4% of assets. Knight is down around 18% so far this year and Heartland, the tenth largest holding at the end of the first quarter, is down about 20%-no wonder it fell out of the top 10 by the end of the second quarter. Once again, however, you can see that the focused approach comes with risks. And with the fund’s discount narrower than its recent history, now isn’t the time to jump aboard. That said, over time, SOR has rewarded investors for taking on added risks, so don’t write the fund off entirely. For example, over the trailing 15-year period through June, the fund’s annualized total return, which includes reinvested distributions, is nearly 11%. That’s ahead of its benchmark Russell 2500 by about two percentage points a year. And it’s over twice the annualized return of the S&P over the same span. So being selective and betting heavily on management’s best ideas has paid off over time. Just not in the second quarter… Keep it on your watch list If you are looking for a small and mid cap closed-end fund, SOR is one that should be on your watch list. Its expense ratio is around 0.8%, which is very reasonable for a CEF. Yes, that’s notably higher than straight index ETFs, but ETFs in the same space don’t usually have the same distribution history. For example, SOR’s yield is currently around 4.5%. The WisdomTree U.S. SmallCap Dividend Growth ETF (NASDAQ: DGRS ), meanwhile , has an expense ratio of around 0.4%, but yields about half as much even though it’s focused on dividend paying stocks. That said, capital gains account for almost the entire disbursement at SOR, so distributions will fluctuate over time and probably fall in difficult markets. Thus, this is more of a total return play than an income play. That doesn’t mean distribution focused investors should avoid SOR, just that this is an important fact to keep in mind when buying it. In the end, it was a tough second quarter and middling first six months for SOR. That doesn’t make it a bad fund, but it does highlight the risks inherent in the fund’s focused approach. Long-term investors should keep the fund in mind, but don’t bother jumping aboard now because the discount is slimmer than it has been in recent years. Disclosure: I/we have no positions in any stocks mentioned, and no plans to initiate any positions within the next 72 hours. (More…) I wrote this article myself, and it expresses my own opinions. I am not receiving compensation for it (other than from Seeking Alpha). I have no business relationship with any company whose stock is mentioned in this article.
Vanguard Energy ETF: Should You Take A Dose Of Oil?

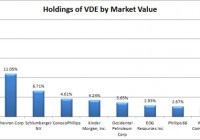
Summary Oil companies seem like a solid natural hedge against higher oil prices and the negative impacts oil prices can have on the economy. VDE has heavy concentration in one company, but I like that holding. The big surprise for me was that high correlation between VDE and the rest of the domestic market. Due to volatility and the high correlation, it appears very difficult to use VDE to reduce total portfolio risk. The low expense ratio is great, but that is not enough to get me to buy into an ETF. When I started looking at the Vanguard Energy ETF (NYSEARCA: VDE ), it looked like a natural fit for my portfolio. The fund is offering diversification while buying up the big oil companies. When it comes to oil, my theory is simple. Holding oil should be a natural hedge to some of the other risks in the economy. When oil prices are doing great, the rest of the economy should be hit by higher gas prices that reduce the amount of capital for consumers to spend at other businesses. The cost of doing business for corporations that rely on physically moving assets should be higher which would compress margins. It is reasonable to assume that VDE should be a great hedge for some of the portfolio risk. I have a bias towards buying high-quality ETFs when I see their prices “dip”. Lately that has been great for me as it has helped me acquire better prices on several of the ETFs I’m holding. On the other hand, if we were to have another major recession where the market fell by 40%, I would’ve been all in by the time the market was down to 5% to 10% and scrambling to get more dry powder to buy more shares when prices were even lower. Largest Holdings The diversification within the ETF is terrible. That sounds like a huge problem, but in this rare case it is not a major issue. If I was going to buy one company to try to hedge against higher oil prices, I would probably pick Exxon Mobil (NYSE: XOM ). That is running around 21% of the portfolio of VDE, as shown below: (click to enlarge) Since XOM is one of the first companies I would want to add to the portfolio, I see VDE as offering diversification for 79% of the investment. From that perspective, the diversification adds a fairly solid benefit relative to only holding one of the major oil producers. When I’m comparing the concentration to the other ETFs I choose, there is no way I would accept so much concentration in any of the other ETFs. Surprises When I ran the statistical analysis over the last 5 years, I was surprised to see the results. I expected oil to appear fairly volatile after the problems the oil market has seen in the last year. Despite expecting some volatility, I wasn’t expecting these results. (click to enlarge) When I ran the ETF through InvestSpy to check the statistics, the high beta stood out to me. I was expecting a lower beta for the ETF, because I thought the correlation would be lower. Instead, using the last 5 years, the correlation was running at 84%. To run some quick math, when the volatility is almost 50% higher than SPY and the correlation is greater than 80%, you’re not going to find any diversification benefits showing up in the statistical analysis relative to just holding SPY. Regardless of how small the weight was for VDE, it would hurt the total portfolio volatility unless the starting portfolio was very strange. To demonstrate that point, I ran a sample portfolio that was 99% Vanguard Total Stock Market ETF (NYSEARCA: VTI ). I use VTI for a substantial portion of my portfolio because I value the diversification. I’m not using it as 99%, but I think this demonstrates precisely the challenge in using VDE. (click to enlarge) When an ETF is only used for 1% of the portfolio, even high levels of volatility can be dealt with by simply diversifying away the risk. However, the high correlation between VDE and the domestic U.S. market is preventing it from gaining those benefits. Double Dipping on Exposure The simplest argument for VDE having such a high correlation with the total stock market ETF and with the S&P 500 would be that XOM is already an enormous company and thus it is influencing both ETFs. However, the problem with that argument is that XOM is only 1.53% of the VTI portfolio. Expense Ratio The expense ratio is only .12%, which is a good reasonable ratio. Unfortunately, a low expense ratio is not enough by itself to get me to invest in a fund. Conclusion I like the idea of increasing my oil exposure and regularly rebalancing the position after seeing how far some of the sector has fallen. Despite that desire, the combination of volatility and correlation makes it much harder for me to justify using a heavy exposure to the sector. Perhaps I need to measure the returns over longer sample periods such as quarters at a time to test for lower correlation levels. That might reduce the correlation of returns, and I’m more likely to assess the performance of my portfolio on a monthly or quarterly basis. I look for opportunities to invest more often than that, but I don’t want to sweat minor changes. Disclosure: I am/we are long VTI. (More…) I wrote this article myself, and it expresses my own opinions. I am not receiving compensation for it (other than from Seeking Alpha). I have no business relationship with any company whose stock is mentioned in this article. Additional disclosure: Information in this article represents the opinion of the analyst. All statements are represented as opinions, rather than facts, and should not be construed as advice to buy or sell a security. Ratings of “outperform” and “underperform” reflect the analyst’s estimation of a divergence between the market value for a security and the price that would be appropriate given the potential for risks and returns relative to other securities. The analyst does not know your particular objectives for returns or constraints upon investing. All investors are encouraged to do their own research before making any investment decision. Information is regularly obtained from Yahoo Finance, Google Finance, and SEC Database. If Yahoo, Google, or the SEC database contained faulty or old information it could be incorporated into my analysis.

An International ETF That Has It All (And It’s Cheap)

Investors have widely favored international exchange traded funds over U.S.-focused equivalents this year. The preference has been for developed markets funds even with emerging markets equities trading at compelling discounts. Nearly 18 percent of VXUS’s weight is allocated to emerging markets equities. By Todd Shriber, ETF Professor Investors have widely favored international exchange traded funds over U.S.-focused equivalents this year. Eight of the top 10 asset-gathering ETFs on a year-to-date basis are international ETFs while just one of the 10 worst ETFs in terms of outflows is an international fund. The preference has been for developed markets funds even with emerging markets equities trading at compelling discounts. For investors looking for exposure to both developed and emerging markets under the umbrella of a single fund, there is the Vanguard Total International Stock Index Fund ETF (NASDAQ: VXUS ) . VXUS is up almost 1.6 percent year-to-date, a performance that lags the S&P 500 and other major developed market benchmarks, but one that is also sturdy when considering the weakness in emerging markets stocks. VXUS features nearly 40 countries in its portfolio with weights ranging from 0.1 percent for four nations to 17.6 percent for Japan. VXUS “is dominated by blue-chip multinationals, which during the past few years have benefited from improving productivity, cheap financing, and exposure to faster-growing emerging markets. Most of these firms are in good financial shape. However, now that the U.S. Federal Reserve’s quantitative-easing program has ended, there is uncertainty as to how monetary policy will be managed and how it might ultimately affect global asset prices–especially considering that valuations across most major asset classes appear to be somewhat stretched,” according to a Morningstar research note . Other Advantages VXUS has some other advantages. With its wide-ranging country exposure, VXUS holds nearly 5,900 stocks across all cap spectrums. That is the deep bench strategy that is the hallmark of so many Vanguard ETFs and one that ensures the firm’s broad market ETFs offer investors all-encompassing or close to all-encompassing exposure to a region or regions. Even when adding up a popular, diversified developed markets ETF with an equivalent emerging markets fund, investors would find it difficult to get exposure to nearly 5,900 stocks. Nearly 18 percent of VXUS’s weight is allocated to emerging markets equities. The ETF tracks an index from FTSE Russell, which classifies South Korea as a developed market. Asia’s fourth-largest economy is 2.9 percent of VXUS. Another VXUS perk, and it is one Vanguard investors are familiar with, is a low expense ratio. VXUS charges just 0.14 percent per year, or $14 per $10,000 invested. Europe looms large in VXUS with developed and emerging European countries combining for over 47 percent of the ETF’s weight. “At this time, the European Central Bank is doing whatever it can to preserve the European Union and prevent the eurozone from going into a deflationary spiral. During the past few years, European equities, as measured by the MSCI Europe Index, have recovered from 2012 lows. However, this rally was muted for investors in this fund because of the falling euro against the U.S. dollar. The MSCI Europe Index, in U.S. dollars, returned 7.6% in the two-year period through July 2015; in local currencies, the index returned 13.2%,” said Morningstar. Disclaimer: Neither Benzinga nor its staff recommend that you buy, sell, or hold any security. We do not offer investment advice, personalized or otherwise. Benzinga recommends that you conduct your own due diligence and consult a certified financial professional for personalized advice about your financial situation. Disclosure: I/we have no positions in any stocks mentioned, and no plans to initiate any positions within the next 72 hours. (More…) I wrote this article myself, and it expresses my own opinions. I am not receiving compensation for it. I have no business relationship with any company whose stock is mentioned in this article.