Tag Archives: alt-investing

Is It The Right Time For Homebuilder ETFs?

An improving economy and an impressive recovery in the housing market boosted the U.S. homebuilder sentiment in June to a nine-month high. The National Association of Home Builders (NAHB)/Wells Fargo housing market index rose five points from May to 59 in June, in line with the September 2014 reading. The September’s reading was the highest since Nov 2005. The sentiment also exceeded the market expectation of 56 points. Meanwhile, the report also showed that the index that measures sales expectations for the next six months jumped six points to 69 in June. Also, the index measuring buyer traffic increased five points to 44. Moreover, the report revealed that the three-month moving average indexes in the South, Northeast and West witnessed a healthy increase in June. Though the index declined in the Midwest to 54, the reading above 50 indicated that builders were still optimistic for the region. All of these data show that the housing market is set for a strong performance this year overcoming the negative impact of a harsh winter in the first quarter. The Chief Economist at NAHB David Crowe said that readings “are at their highest levels since the last quarter of 2005, indicating a growing optimism among builders that housing will continue to strengthen in the months ahead.” Impressive Housing Recovery Most of the major housing data that released in May were encouraging. While new home sales surged 6.8% in April, construction spending soared to a more than six-year high. Also, Pending Home Sales Index, which measures housing contract activity, gained 3.4% from the previous month to 112.4 in April, hitting its highest level since May 2006. Existing home sales were the only major housing data that failed to increase in April. However, it is speculated that existing home sales in 2015 may reach the highest level since 2006. Separately, a rise in home prices also signaled toward an increase in demand in the housing market. The S&P/Case-Shiller’s 20-City composite index, the leading measure of U.S. home prices, rose 5% year on year in March. Similarly, the 10-City composite index increased 4.7% year on year in March. Economic Improvement After the first-quarter slowdown, several indicators signaled that the economy is gradually gaining strength. According to the U.S. Labor Department, the U.S. economy created a total of 280,000 jobs in May, witnessing the largest job addition since December 2014. Though the unemployment rate marginally rose to 5.5% in May, the rate is expected to decline gradually to Fed’s target this year. Average hourly wages also saw an impressive year-on-year gain of 2.3%, indicating a strong recovery in labor market conditions. Moreover, factors including improving consumer confidence, low oil prices and the prevailing low rate environment have boosted the housing market in recent times. Despite the prospect of a rate hike this year, the outlook for the housing market remains positive for the year. Rising Rate Concerns The mortgage-finance company Freddie Mac reported that the average rate for a 30-year fixed mortgage climbed to an eight-month high of 4.04% for the week ending June 11 from 3.87% from the previous week. This represents the sharpest increase since 2013. However, increase in mortgage rates seems to have a negligible impact on housing as demand remained strong following the concern that rates will continue to move higher. Meanwhile, strong economic data indicates that the economy is back on track in the second quarter, leaving behind the first quarter contraction. This raised the possibility of a rise in interest rates, which have been near zero since the 2008 financial crisis. Analysts are expecting a possible rate hike in September or October this year, which may have a negative impact on the housing market. ETFs in Focus Homebuilder ETFs may see a boost in the near future on the back of a favorable economic environment. However, investors will closely watch the prospect of a rate hike this year and its impact on the housing market. In this scenario, we highlight two homebuilders ETFs that will remain on investors’ radar in the coming days. SPDR S&P Homebuilders ETF (NYSEARCA: XHB ) This fund provides exposure to 37 firms by tracking the S&P Homebuilders Select Industry Index. The fund is also quite popular with $1.7 billion in its asset base while it sees a solid volume of more than 4 million shares a day. None of the firms accounts for more than 3.72% of the total assets. Sector-wise, Homebuilding takes the top spot at about 33% share while Building Products, Homefurnishing Retail and Homefurnishings also have double-digit allocation. XHB charges a fee of 35 bps annually and has a Zacks Rank #3 (Hold) with a High risk outlook. The fund has returned 2.3% over the past three-month period and rose 6.7% this year. PowerShares Dynamic Building and Construction (NYSEARCA: PKB ) This product tracks the Dynamic Building & Construction Intellidex Index, holding 30 securities in its basket. The fund charges 63 bps in fees. Nearly 46% of the fund’s assets are allocated to the top 10 holdings. PKB has amassed $54.5 million in its asset base while it has an average daily volume of around 15,000 shares. The product has a Zacks Rank #3 with a High risk outlook. The ETF has returned 4.2% over the past three-month period and gained 11% in the year-to-date frame. Original Post

Alternative Funds: Cause For Concern?

This is the platinum jubilee year for the 75-year old “legal framework” Investment Company Act of 1940. While this framework for mutual funds and other funds in the U.S. along with the Securities and Exchange Commission have continued to be the backbone of U.S. financial regulation, there are “some cracks” starting to appear. At an event at the Brookings Institution in Washington on mutual funds over the next 75 years, SEC commissioner Kara Stein said: “I am concerned that we are starting to see some cracks in the foundation”. The primary concerns were related to mutual funds and exchange-traded funds that make use of significant portion of leverage, invest in illiquid securities and execute strategies like hedge funds. Kara Stein said that these mutual funds and ETFs are using complex and risky strategies to bet on illiquid assets “often operate in a gray area of mutual fund regulation.” These so-called alternative funds have soared in popularity. Morningstar noted that the market increased to $311 billion in assets under management at the end of 2014 from $46 billion in 2008. Alternative Funds under Scanner The alternative mutual funds, at the center of this issue, are “hard to define” and Stein says that they “mean different things to different people”. However, they use an investment strategy in a nontraditional asset class and may invest in illiquid assets. They “also frequently seem to rely on derivatives for their investment returns,” said Stein. The alternative mutual funds duplicate hedge funds to outperform markets and attract investors. However in doing so, they may not adhere to Investment Company Act of 1940’s liquidity and leverage rules. Funds Flout Investment Company Act of 1940 Framework Despite the existing rules, Stein says that many funds are avoiding some restrictions and in certain cases also relying on exemptions granted by SEC staff. Here we would like to highlight specific requirements of the Investment Company Act of 1940 (as explained by Investopedia): Limit their investment strategies, such as the use of leverage. Maintain a certain percentage of their assets in cash for investors who might wish to sell. Disclose their structure, financial condition, investment policies and objectives to investors. Stein said: “We all need to be asking questions about the development of these funds and what they mean to the retail investor. Do investors understand these products? Are these funds adhering to the foundational principles of the Investment Company Act?” “They may be less liquid, employ more leverage, and invest in exotic and complex instruments… At a minimum, this raises the question of retail investor confusion,” Stein added. Ms. Stein raised concerns that so-called alternative mutual funds appeal to investors as a way to outperform the market by mimicking hedge funds while not adhering to the Investment Company Act of 1940 rules governing liquidity and leverage. Illiquid Bank Loans Separately, the “new, complicated registered funds” that invest in bank loans are also a cause of concern. Many of the underlying loans in these funds may take more than a month to settle. “If it takes over a month to settle, it is reasonable to wonder how the fund could possibly meet the seven-day redemption requirement in the Investment Company Act in times of market stress,” said Stein. What is concerning is that these bank loan funds’ holdings may be entirely of illiquid bank loans. This completely ignores the SEC’s 15% threshold. The SEC guidance states mutual funds may hold up to 15% of fund’s assets in illiquid securities. “Some may also invest in collateralized loan obligations (CLOs). How is this happening?” Stein questioned. Regulators Get Busy While the rules require funds to disclose enough information for investors, Stein said that there has been a shift that “places the onus on the retail investor to figure out whether a fund is right for him or her.” Stein added: “The liquidity of registered funds is one area where it seems that regulation has drifted into “buyer beware.” The comments juxtapose with the SEC and other regulators’ recent close scrutiny of the asset management sector. They are even questioning if certain products are risky affairs now. Recently, the Securities and Exchange Commission proposed a rule recently that mutual fund companies must disclose how vulnerable their bond portfolios are to rate hikes. The plan requires mutual funds to publish their exposure to derivatives, repurchase agreements, and securities lending. The reports will also contain details about position-level holdings, counterparty exposures, derivatives contracts terms and the risks associated with rate hike. Talking of bond funds, there is a growing concern that a massive exit from bonds may freeze the markets as the number of sellers may not match the number of buyers. Redemption of bonds would increase the sell off and then fund managers will have to sell the less liquid assets to match the investors’ cash demands. However if a mutual fund or an ETF holds illiquid bonds, the price swings will be rapid and would create a vicious cycle as price drops will again intensify selling pressure. As for risks, Financial Stability Board’s (FSB) contemplation to designate the biggest asset managers as “systemically important” has not gone down well with top fund managers. Mark Carney, chair of the FSB, said the risk on investor runs on “funds that offer on-demand redemptions but invest in less liquid assets.” Alternative Mutual Funds These mutual funds, as said earlier, make use of leverage, short selling and hedging actions among others. If the concerns are true, investors may want to avoid the following mutual funds that have similar strategies. American Beacon Flexible Bond A (MUTF: AFXAX ) invests in fixed-income instruments that have varying maturities and derivative instruments providing exposure to fixed income instruments. While a meager 0.54% of assets are invested in stocks and 8.16% in cash, AFXAX has 300.8% of assets allocated to bonds. AFXAX currently carries a Zacks Mutual Fund Rank #5 (Strong Sell). Toews Hedged Core Frontier Fund (MUTF: THEMX ) invests in ETFs, derivative instruments, fixed income securities, common stock and cash equivalents related to emerging market issuers outside the U.S. and even of U.S. issuers. THEMX has lost 7.2% and 7.5% year to date and over 1 year period. The 3 and 5 year annualized returns are -3.5% and -7.9%. THEMX currently carries a Zacks Mutual Fund Rank #4 (Sell). However, investors may instead buy Balanced mutual funds as they enjoy the flexibility of varying the proportion of equity and fixed income investments in response to market conditions. PIMCO StocksPLUS Fund D (MUTF: PSPDX ) and Putnam Dynamic Asset Allocation Balanced Fund (MUTF: PABYX ), both carrying Zacks Mutual Fund Rank #1 (Strong Buy), should be good additions to the portfolio. Link to the original post on Zacks.com

Comparing Healthcare Price Range Forecasts Of Market-Makers

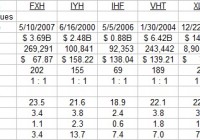
Summary Holdings of healthcare ETFs provide widely varied focuses on aspects of this broad ranging, important industry’s activities. ETFs and their separate holdings all can be directly compared as wealth-building investment candidates. Price-change prospects are seen in the hedging actions of market-makers at work. Qualitative criteria: Odds for investor profit, size of price change payoff, credibility of forecast, likely extreme price drawdown exposure, and anticipated holding period requirements. All have prior experience histories. Meaningful risk/reward comparisons and other personal-preference qualitative investing considerations provide the investor with an array of appropriate choices of securities positions. Contained here are specific price sell targets, holding period time limits, and prior price-risk exposure experiences. These guidelines encourage investor-set boundary disciplines for portfolio management. Healthcare is an important, wide-ranging industry ETFs with healthcare-provider holdings have very different emphases. Knowing what is involved, and the emphasis contained, is essential to addressing investment objectives of completeness and diversity. Just as the energy industry has a wide array of participants with differing principal activities, so too does the healthcare field have its important essential specialties and integrators in supportive-competitive relationships with one another. Parallels between the two distinctly different economic sectors are suggestive. Energy wildcatters of the Exploration & Production dimension have their functions in healthcare among the Biotechnology developers. Oilfield services providers have some healthcare similarities in the roles played by healthcare insurance companies. Medical equipment producers and developers have their counterparts in the energy scene. Transportation and delivery of energy products are paralleled by healthcare services organizations. Significant similarity of role exists between integrated international oil companies and major pharmaceutical organizations. We will not attempt precise categorization in an industry where we have limited experience or familiarity. The point is that the diversity of activities in each field comes together at the point of making investment choices. Those choices may, and in our opinion should, be more influenced by the investor’s objectives and perspective, than by a morass of minute distinctions between participants in their related fields. In every case what counts for the investor is whether or not the subject of an investment choice will be seen to be an effective competitor, for the period of the investment holding. Effective not only among the direct competing participants in the field of concern, but also among the full range of competitors for the use of the investor’s capital. Where investing “rubber meets the road”, capital meets commitment. Critically, with investments, perspective and opinion play a dominant role. Why this information is different from the usual It is intended to be a current update for active investors who have an awareness of what kinds of RATES of return they need to build wealth deliberately for specific purposes that tend to have inflexible need dates. For investors aware that normal price fluctuation in good-quality equity investments during the course of a year regularly provides capital appreciation opportunities which are multiples of the trend growths of those same securities. While not intended principally for long term, buy-and-hold investors salting away capital for an indeterminate general purpose sometime in the indefinite future, it may well be of help for those who have arrived at a decision time for portfolio strengthening in the healthcare area. All investors are, or should be, aware of the need to make comparisons between alternatives in their quest for objective satisfactions. Our intent is to urge a focus on the kind of universal investing dimensions that make comparisons valid across a wide range of subjects. The matter of price is a pervasive issue in any type of investment decision. Active investors need to know that the market professionals who assist portfolio managers of billion-dollar investment funds in adjusting their holdings have a special insight into the likely market actions that are making prices move. Moreover, because the pros must put firm capital at risk temporarily to do their job, they make price-hedging transactions in derivative markets to protect themselves. What they will pay for that insurance, and the way the deals are structured, tell just how far it appears likely that prices may move, both up and down. Analysis of their behavior is performed systematically, daily, on over 3,000 equity securities, stocks, ETFs, and market indexes. As it has been since Y2K. Careful record-keeping provides an actuarial history of how well the market-making community can anticipate price changes, issue by issue, in coming weeks and months. Here we apply that analysis and its perspective to six of the Exchange Traded Funds, ETFs, that hold securities of healthcare corporations. Subjects of the study The ETFs of interest here are Health Care Select Sector SPDR ETF (NYSEARCA: XLV ), Vanguard Health Care ETF (NYSEARCA: VHT ), First Trust Health Care AlphaDEX ETF (NYSEARCA: FXH ), iShares U.S. Healthcare ETF (NYSEARCA: IYH ), iShares U.S. Healthcare Providers ETF (NYSEARCA: IHF ), and Direxion Daily Healthcare Bull 3x ETF (NYSEARCA: CURE ). Considerable differences exist between these 6 ETFs. One has been around since 1998 while another barely has a 4-year history. Another is structured in its makeup and holdings to cause its prices to have changes 3 times as large as the industry index. One is very concentrated in its holdings with ten names making up nearly two-thirds of its value. Another’s top ten holdings make up less than a quarter of its worth. The biggest ETF has investor commitments of over $14 billion; the smallest, less than a half-billion. One trades 9 million shares a day, another only does 90,000. Figure 1 provides the fundamentals: Figure 1 Most sell at P/Es just above 20, and at near 4x book value, save for IHF and less so, FXH. XLV and CURE are actively traded, with their entire capitalizations able to be turned over in 4-5 weeks. VHT and FXH both have considerably less liquid situations. What do they each hold? In Figure 2, the ten largest holdings of each are identified, with considerable duplication in a few names. XLV, VHT, and IYH have the most similar portfolios. FXH and IHF have a far more diverse set of stocks. Figure 2 UnitedHealth (NYSE: UNH ) and Actavis (NYSE: ACT ) are each in 4 of the ETFs. The largest average size holding is Johnson & Johnson (NYSE: JNJ ) with 3 ETFs each committing over 9% of their assets. But 14 stocks are held by only one ETF, out of the 25 issues so identified. The 3x leveraged ETF holds an undesignated mix of derivative securities to accomplish its special price characteristic in relation to the Health Care Select Sector Index. Some of the ETFs focus on big, established healthcare names like big-pharma producers, others like FXH and IYF look to more recent industry innovators. Comparing holdings’ prospects The investment prospects for each ETF should reflect the prospects for its major holdings, but that is not always so. Figure 3 shows how market-makers currently appraise the upside prospects for each of the larger ETF holdings in relation to the actual worst-case price drawdowns following prior forecasts like today’s. Figure 3 (used with permission) This picture plots ETF locations by coordinates of upside price change return forecasts on the lower horizontal scale, and by worst-case downside price change experiences following earlier forecasts like those of the present. The attractive green area contains issues with 5 times or more upside than downside prospects. The diagonal dotted line is the point at which price risk is expected to be equal to return. Issues higher than the diagonal have more risk than return, lower have better price change returns than risk exposure. Several issues share common locations. Comparing ETF risks and rewards Figure 4 provides the same comparisons for the Healthcare ETFs themselves, along with a market index norm in the form of SPDR S&P 500 Trust ETF (NYSEARCA: SPY ): Figure 4 The extreme compression of risk/reward tradeoffs pictured in Figure 4 indicates a market belief that despite high prices (limiting further upward price moves) in the foreseeable near future, these ETFs are market-correction resistant. But they are also viewed as under-performers relative to the market average SPY ETF at location [7]. Even CURE, with a 3x price leverage is seen to have an upside prospect of less than +5%, along with a downside history of some -5%. These valuations for the ETFs are significantly less optimistic than those held for their most important holdings in Figure 3, where upside prospects are all above +5%. None of their downsides have been, at worst, greater than their upsides, and many nowhere near as bad. To see what is driving the ETF situation, look at Figure 5. Figure 5 (click to enlarge) Here are the current MM forecasts for the healthcare ETFs, and the market outcome histories subsequent to similar forecasts. The mystery of compressed return forecasts from persistent high prices is at least partly explained in Figure 5’s columns 8 through 11. Four of the six have NEVER had a loss in their past 5-year histories following Range Indexes like today’s, and the other two are either 8 or 9 wins out of ten. Column 10 provides the real answer for the winning four, with holding periods ranging from only 9 to 17 market days. Even with their miniscule, below +5% gains, the annual rates of profit have been for the big winners multiples of 2x to 11x that of the market average. The other two candidates exceeded SPY’s annual rate of return by 500 to 700 basis points. Conclusion In a market environment highly expectant of a price correction, but one where that concern has been present for months, something that can produce very attractive rates of return one short holding period after another has real appeal for active investors. Here, there is an array of near-term investment candidates with high promise of reward at appealing rates, and prior experiences of fairly trivial price drawdowns during the brief holding periods needed to reach sell targets. Disclosure: The author has no positions in any stocks mentioned, and no plans to initiate any positions within the next 72 hours. (More…) The author wrote this article themselves, and it expresses their own opinions. The author is not receiving compensation for it (other than from Seeking Alpha). The author has no business relationship with any company whose stock is mentioned in this article.