Author Archives: Scalper1

We Eat Dollar Weighted Returns – VII

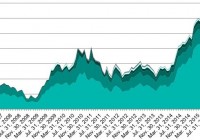
Photo Credit: Fated Snowfox I intended on writing this at some point, but Dr. Wesley Gray (an acquaintance of mine, and whom I respect) beat me to the punch. As he said in his blog post at The Wall Street Journal’s The Experts blog: WESLEY GRAY: Imagine the following theoretical investment opportunity: Investors can invest in a fund that will beat the market by 5% a year over the next 10 years. Of course, there is the catch: The path to outperformance will involve a five-year stretch of poor relative performance. “No problem,” you might think-buy and hold and ignore the short-term noise. Easier said than done. Consider Ken Heebner, who ran the CGM Focus Fund, a diversified mutual fund that gained 18% annually, and was Morningstar Inc.’s highest performer of the decade ending in 2009 . The CGM Focus fund, in many respects, resembled the theoretical opportunity outlined above. But the story didn’t end there: The average investor in the fund lost 11% annually over the period. What happened? The massive divergence in the fund’s performance and what the typical fund investor actually earned can be explained by the “behavioral return gap.” The behavioral return gap works as follows: During periods of strong fund performance, investors pile in, but when fund performance is at its worst, short-sighted investors redeem in droves. Thus, despite a fund’s sound long-term process, the “dollar-weighted” returns, or returns actually achieved by investors in the fund, lag substantially. In other words, fund managers can deliver a great long-term strategy, but investors can still lose. That’s why I wanted to write this post. Ken Heebner is a really bright guy, and has the strength of his convictions, but his investors don’t in general have similar strength of convictions. As such, his investors buy high and sell low with his funds. The graph at the left is from the CGM Focus Fund, as far back as I could get the data at the SEC’s EDGAR database. The fund goes all the way back to late 1997, and had a tremendous start for which I can’t find the cash flow data. The column marked flows corresponds to a figure called “Change in net assets derived from capital share transactions” from the Statement of Changes in Net Assets in the annual and semi-annual reports. This is all public data, but somewhat difficult to aggregate. I do it by hand. I use annual cash flows for most of the calculation. For the buy and hold return, I got the data from Yahoo Finance, which got it from Morningstar. Note the pattern of cash flows is positive until the financial crisis, and negative thereafter. Also note that more has gone into the fund than has come out, and thus the average investor has lost money. The buy-and-hold investor has made money, what precious few were able to do that, much less rebalance. This would be an ideal fund to rebalance. Talented manager, will do well over time. Add money when he does badly, take money out when he does well. Would make a ton of sense. Why doesn’t it happen? Why doesn’t at least buy-and-hold happen? It doesn’t happen because there is an Asset-Liability mismatch. It doesn’t matter what the retail investors say their time horizon is, the truth is it is very short. If you underperform for less than a few years, they yank funds. The poetic justice is that they yank the funds just as the performance is about to turn. Practically, the time horizon of an average investor in mutual funds is inversely proportional to the volatility of the funds they invest in. It takes a certain amount of outperformance (whether relative or absolute) to get them in, and a certain amount of underperformance to get them out. The more volatile the fund, the more rapidly that happens. And Ken Heebner is so volatile that the only thing faster than his clients coming and going, is how rapidly he turns the portfolio over, which is once every 4-5 months. Pretty astounding I think. This highlights two main facts about retail investing that can’t be denied. Asset prices move a lot more than fundamentals, and Most investors chase performance These two factors lie behind most of the losses that retail investors suffer over the long run, not active management fees. Remember as well that passive investing does not protect retail investors from themselves. I have done the same analyses with passive portfolios – the results are the same, proportionate to volatility. I know buy-and-hold gets a bad rap, and it is not deserved. Take a few of my pieces from the past: If you are a retail investor, the best thing you can do is set an asset allocation between risky and safe assets. If you want a spit-in-the-wind estimate use 120 minus your age for the percentage in risky assets, and the rest in safe assets. Rebalance to those percentages yearly. If you do that, you will not get caught in the cycle of greed and panic, and you will benefit from the madness of strangers who get greedy and panic with abandon. (Why 120? End of the mortality table. Take it from an investment actuary. We’re the best-kept secret in the financial markets.) Okay, gotta close this off. This is not the last of this series. I will do more dollar-weighted returns. As far as retail investing goes, it is the most important issue. Period. Disclosure: None

An Interest Hike Doesn’t Mean That Gold Price Must Crash

Summary The Fed chairwoman Janet Yellen stated that the U.S. economy is strong enough for the Fed to start raising the benchmark interest rate. The pace of the U.S. GDP growth and the inflation rate don’t indicate that there is any need to raise the interest rate. Any interest rate hike will be probably only symbolical and it won’t be followed by another interest rate hike anytime soon. History shows that gold and GLD prices often react on the interest rate changes in contrary to the theory and general expectations. Gold price has been in a strong downtrend for the last couple of weeks. The SPDR Gold Trust ETF (NYSEARCA: GLD ) reached a new multi-year low, just shy of the $100 level. It represents a more than 10% decline since the middle of October. The decline was driven by increased expectations that the Fed will raise the key interest rate as soon as in December. The probability was further supported by a very strong October job report . Although the November data are a little weaker and some of the economists, including Peter Schiff claim that the state of the U.S. economy is worse than the numbers show, statements of the Fed representatives still indicate that the interest rate may be hiked this month. According to Janet Yellen, chairwoman of the Fed, the U.S. economy is strong enough for the Fed to start raising the benchmark interest rate. Is an interest rate hike needed? The probability of a December interest rate hike is high, although I don’t see any good reason why to raise it. Yellen explained why the Fed wants to raise the interest rate when she stated : Were the FOMC to delay the start for too long, we would likely end up having to tighten policy relatively abruptly to keep the economy from overshooting. Such an abrupt tightening would risk disrupting financial markets and perhaps even inadvertently push the economy into a recession. Yes, the reason is good. The above-mentioned statement makes sense. But the officially-presented data don’t indicate any risk of an overshooting anytime soon. The annual pace of the GDP growth rate is only slightly above 2% and the inflation rate is at 0.2%! Actually, the deflation is much more probable than overheating of the economy, according to the official data. There are a lot of discussions about the accuracy of the officially-presented data. For example, according to John Williams and his website Shadowstats.com , the current inflation rate is close to the 4% level using the 1990 methodology, and it is around 7.5% using the 1980 methodology. In this case, we can start to speak about overheating of the economy. It really seems that the Fed publicly presents one set of macroeconomic data and it makes policy decisions based on another one. (click to enlarge) Source: Trading Economics Moreover, raising the interest rate too much may damage the U.S. economy. The strong USD already has a negative impact on the U.S. exporters. It may also damage the foreign economies, as a lot of the companies around the world have big USD-denominated debts, and they are dependent on revenues denominated in other currencies. As the value of these currencies falls, the companies will have more and more problems with the debt service. There are a lot of reasons why to expect that if there is any interest rate hike this December, it will be only symbolical and it will probably take quite a lot of time before another hike will occur. There are various economists who have the same opinion and they don’t see any good reason to increase the interest rate right now. One of them is Peter Schiff who expects that the Fed will leave the interest rate unchanged or it will raise it by 0.25%. He assumes that both of the outcomes will be positive for gold, as the markets have already factored in substantially more than a 0.25% interest rate growth. How did GLD share price react in the past? Although theory says that GLD price should decline after an interest rate hike and it should grow after an interest rate cut, history shows that this anticipation is often wrong. The financial markets always try to predict the future development, and the interest rate change is often reflected by the asset prices before the rate change itself is officially announced. And if there was a strong trend before the rate change, the trend may get disrupted for some time, although it tends to resume after the dust settles down. 22 interest changes occurred since the inception of GLD. In 12 cases, the interest rate was increased and in 10 cases it was decreased. The table below shows the development of GLD share price 20, 10 and 5 trading days before the rate change and 5, 10 and 20 days after the rate change. It is interesting that on average, GLD price grew before the interest rate change and it was in a slight decline 5 and 10 trading days after the rate change. But 20 trading days after the rate change, it was back in green numbers. Only in 4 out of 12 cases (33.33%), the GLD price recorded any losses 20 trading days after the interest rate hike. It declined by 4.73% on average. On the other hand, in 66.66% of cases, the GLD price recorded gains (5.08% on average). In 4 cases (33.33%), the GLD price just kept on growing, without any reaction on the interest rate hike. After the Fed started to cut the interest rates, GLD was down in 50% of the cases after 20 trading days. After the interest rate cuts on March 18, 2008, October 8, 2008 and December 16, 2008, a strong growth trend turned into a steep decline. It shows that GLD often reacts contrary to the theory not only after interest rate hikes but also after interest rate cuts. (click to enlarge) Source: own processing, using data of Yahoo Finance and the Fed Conclusion If the Fed hikes the interest rate during its meeting on December 15/16, it doesn’t mean that gold and GLD prices must crash. The official macroeconomic data don’t indicate that the U.S. economy should start to overheat anytime soon; moreover, a too strong USD may hurt not only the U.S. economy. Any rate hike will be only symbolical and it will probably take a long time before another one will occur. The markets may actually welcome that the more than a year long saga is finally over, and the GLD price may react positively. As the not-so-distant history shows, it wouldn’t be the first time when GLD price grows after an interest rate hike. Adding to it the problems the gold miners have to face at the current gold prices and the high demand for physical gold, GLD presents an interesting contrarian opportunity.

By The Numbers: ETF Investment And The Indian Market

By Utkarsh Agrawal Since the introduction of ETFs, the dynamics of investing has changed dramatically. Apart from being more transparent, with lower costs and improved tax efficiency, ETFs have helped create the opportunity for smaller investors to access asset classes previously available only to institutional investors. Emerging markets tend to be riskier than developed markets, but can also offer diversification opportunities. With emerging market ETFs, it has become possible to incorporate the objectives and constraints of investors who desire exposure to emerging markets in their portfolio construction process. Among emerging markets, India has been one of the preferred countries. The assets under management (AUM) and the number of the ETFs that provide exposure to India have increased tremendously. All of these ETFs are based on Indian equities. As of July 2015, there were 27 of them, with combined AUM of USD 12.80 billion, domiciled across seven countries (see Exhibit 1). The U.S. has been the greatest contributor in terms of both AUM and the number of ETFs, followed by France, Singapore, and other countries. Since August 2015, the combined AUM has decreased by more than USD 2.27 billion, amounting to a decline of almost 18%, and it stood at USD 10.53 billion as of September 2015. This reduction in AUM has also contributed to the volatility of the equity market and the exchange rate in India. Exhibit 1: International Equity ETFs That Provide Exposure to India Source: Morningstar. Data as of Sept. 30, 2015. Chart is provided for illustrative purposes. As opposed to the international Indian ETFs, India’s domestic ETFs are not only limited to equities. They also include commodities, fixed income investments, and money markets (see Exhibit 2). As of September 2015, the total number of domestic ETFs was 51, and the combined total AUM stood at USD 2.09 billion. The proportion of domestic equity ETFs in the combined total AUM was almost 48%, at USD 1.00 billion as of September 2015. The AUM of the domestic equity ETFs in India account for just 10% of that of the international equity ETFs that provide exposure to India. The recent rise in AUM of India’s domestic equity ETFs can be attributed to the introduction of the Central Public Sector Enterprise (CPSE) ETF, as well as the investment by the Employees’ Provident Fund Organization (EPFO). The Central Board of Trustees (CBT), the apex decision-making body of the EPFO, has recently decided to invest in India’s domestic equity ETFs within the prescribed limit of 5%-15% of the total corpus. Exhibit 2: Domestic ETFs in India Source: Morningstar, Association of Mutual Funds in India and Reserve Bank of India. Data as of Sept. 30, 2015. Chart is provided for illustrative purposes. The S&P BSE SENSEX , India’s heavily tracked bellwether index, is designed to measure the performance of the 30 largest, most-liquid, and financially sound companies across key sectors of the Indian economy. As of September 2015, it has served as the underlying index to one international equity ETF, which provides exposure to India, and five domestic Indian equity ETFs. Over the past 10 years, ending in September 2015, the S&P BSE SENSEX has yielded an annualized total return of 13.32% in Indian rupees (see Exhibit 3). Apart from domestic Indian equity ETFs based on other indices, the EPFO will also invest in the domestic S&P BSE SENSEX ETF, leading to expectations of a further boost to the AUM of this established index. Source: S&P Dow Jones Indices. Data as of Sept. 30, 2015. Chart is provided for illustrative purposes. Past performance is no guarantee of future results. Disclosure: © S&P Dow Jones Indices LLC 2015. Indexology® is a trademark of S&P Dow Jones Indices LLC (SPDJI). S&P® is a trademark of Standard & Poor’s Financial Services LLC and Dow Jones® is a trademark of Dow Jones Trademark Holdings LLC, and those marks have been licensed to S&P DJI. This material is reproduced with the prior written consent of S&P DJI. For more information on S&P DJI and to see our full disclaimer, visit www.spdji.com/terms-of-use .