Scalper1 News
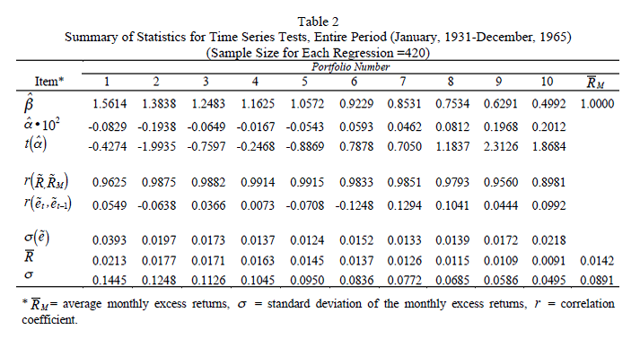
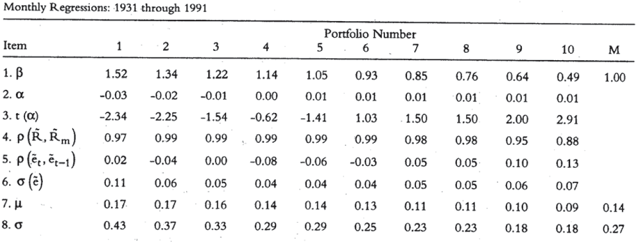
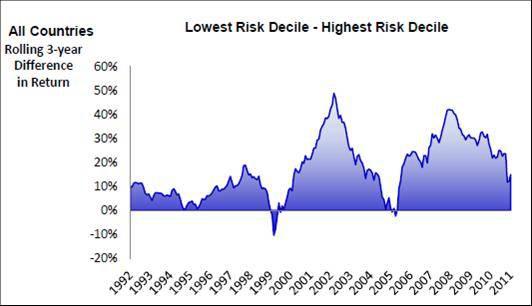 Summary This article introduces a discussion of the theoretical underpinning for the Low Volatility Anomaly, or why lower-risk investments have outperformed higher-risk investments over time. It features long time interval studies of the Low Volatility Anomaly from famed academics, supplementing the more recent 25-year study referenced in the introductory article to the series. The article discusses the divergence between model and market of one of the most oft-cited financial concepts. Given the long-run structural alpha generated by low volatility strategies, I want to dedicate a more detailed discussion of the efficacy of this style of investing for Seeking Alpha readers. Providing a detailed theoretical underpinning of the strategy or detailing multiple examples of its outperformance can prove challenging in a single blog post, so I am providing a more academic examination of the topic over multiple articles that each zero in on a separate proof point describing the strategy. In the first article in this series, I provided an introduction to the Low Volatility Anomaly with an example depicting the outperformance of a low-volatility (NYSEARCA: SPLV ) bent to the S&P 500 (NYSEARCA: SPY ) relative to the broader market and high-beta stocks. In this second article, I am going to begin to delve into a theoretical underpinning for the Low Volatility Anomaly and demonstrate that it has been proven in research dating back to the 1930s. Theoretical Underpinning for the Low Volatility Anomaly Since its introduction in the early 1960s, the Capital Asset Pricing Model (CAPM) has permeated the investment management landscape. CAPM is used to determine a theoretically appropriate required rate of return of an asset added to a diversified portfolio. This model takes into account the asset’s sensitivity to non-diversifiable risk, which is oft represented through the beta coefficient. In CAPM, in what has become one of the most fundamental formulas of modern finance, the expected return of an asset is equal to the risk-free rate plus the product of beta multiplied by the difference between the expected market return less the risk-free rate, as seen in the following equation: E(R a ) = R f + Β a *(E(R m )-R f ) The idea of beta is axiomatic to many investment managers. Investment discussion is littered with the concept of beta. High-beta investments have higher expected returns and above-market risk. As we move back down the security market line (SML), the inverse is then true for low-beta investments, characterized by lower expected returns and below-market risk. Empirical evidence, academic research and long time series studies across asset classes and geographies have shown that the actual relationship between risk and return is flatter than the model or market expectations suggests. At the extremes, and as shown in the graphs above in this article, the relationship between risk and return might indeed be negative. Understanding the shortcomings of CAPM and the market’s misinformed notion of the relationship between beta, risk and expected return could produce a normative arbitrage opportunity that is exceedingly capital-efficient. If the Capital Asset Pricing Model held in practice, we should see a linear relationship between beta and return as predicted by the model. Low-beta/lower-volatility assets would be expected to generate proportionately lower returns than the market. Since CAPM can be mathematically derived, and this series will subsequently demonstrate that it has failed in empirical tests, then the assumptions underpinning CAPM must be unable to hold in practice. Criticisms of the Capital Asset Pricing Model are almost as old as the model itself, but the model’s simplicity and utility have become ingrained in modern finance nonetheless. In 1972, Black, Scholes and Jensen, in a study of NYSE-listed stocks from 1931-1965, found that when securities were grouped into deciles by their beta, a time series regression of these portfolios’ excess returns on the market portfolio’s excess returns indicated that high-beta securities had significantly negative intercepts and that low-beta securities had significantly positive intercepts – a contradiction to the expected finding from the CAPM model. An excerpt of their findings is tabled below, expanding the scope of the Low Volatility Anomaly far longer than my simple twenty-five year charts. High-beta stocks (left) had negative alpha, and low-beta stocks (right) had positive alpha. (click to enlarge) Excerpted from “The Capital Asset Pricing Model: Some Empirical Tests” by Fischer Black, Michael Jensen and Myron Scholes (1972) Three years later, Robert Haugen and James Heins produced a forty-year study that demonstrated that, over the long run, stock portfolios with lower variance in monthly returns experienced greater average returns than riskier cohorts through multiple business cycles, and that relative returns were time series-dependent. Fischer Black (1993) and Robert Haugen (2012) would both produce academic papers decades later with expanded market data sets that demonstrated the efficacy of low volatility strategies. Black, enshrined in the nomenclature of an option pricing model that won his frequent collaborator Myron Scholes a Nobel Prize after Black’s death, updated his previous study conducted with Scholes and Jensen in 1972 to include data through 1991. A period that takes us from their early Depression-era study and links it with our S&P data from 1991 to current. (click to enlarge) Excerpted from “Beta and Return: Announcement of the Death of Beta Seem Premature”, Fischer Black 1993 In the chart above, one can see that in this expanded sample period, low-beta stocks (right) again did much better than predicted by CAPM (positive alpha), and high-beta stocks did worse still. Robert Haugen published several papers in the subsequent decades focused on the low volatility anomaly. In 1991, Haugen and collaborator Nardin Baker demonstrated that a low volatility subset of the capitalization-weighted Wilshire 5000 would have outperformed from 1972 to 1989. Shortly before Haugen’s death in early 2013, Baker and Haugen demonstrated that from 1990 through 2011, in a sample set that included stocks in twenty-one developed countries and twelve emerging markets, low-risk stocks outperformed in the total sample universe and in each individual country – a study I have previously referenced in past articles. Excerpted from: Low Risk Stocks Outperform within All Observable Markets of the World. Baker and Haugen (2012) If CAPM is a descriptive, but not practicable, model of investing, then violations of its underpinning assumptions could serve as possible explanations for successful strategies that appear to deviate from what one would expect from the model. The following pages are dedicated to examining how violations of CAPM’s assumptions lead to market returns that deviate from expectations. Sharpe (1964) formalized the assumptions underpinning Markowitz’s (1954) Modern Portfolio Theory . With the market fifty years later still thinking about risk-adjusted returns in a ratio bearing his name, it seems prudent to use Sharpe’s underlying model assumptions: Investors are rational and risk-averse, and when choosing among portfolios, they care only about maximizing economic utility of their one-period investment return; A common pure rate of interest, with all investors able to borrow or lend funds on equal terms; Homogeneous investor expectations, including expected values, standard deviations and correlation coefficients; The absence of taxes or transaction costs. The second of these underlying assumptions will form the basis of our first hypothesis, Leverage Aversion, for the existence and persistence of the Low Volatility Anomaly, which will be captured in the next article in this series. Disclaimer My articles may contain statements and projections that are forward-looking in nature, and therefore, inherently subject to numerous risks, uncertainties and assumptions. While my articles focus on generating long-term risk-adjusted returns, investment decisions necessarily involve the risk of loss of principal. Individual investor circumstances vary significantly, and information gleaned from my articles should be applied to your own unique investment situation, objectives, risk tolerance, and investment horizon. Disclosure: I am/we are long SPLV, SPY. (More…) I wrote this article myself, and it expresses my own opinions. I am not receiving compensation for it (other than from Seeking Alpha). I have no business relationship with any company whose stock is mentioned in this article. Scalper1 News
Scalper1 News