Tag Archives: top-ideas

ETFs To Move On Yuan Devaluation

China has been hitting headlines this year for one reason or the other. While the economy has been reeling under pressure for long given the protracted slowdown in the domestic manufacturing sector, credit crunch concerns and a property market slowdown, its stock market has been through a wild ride on overvaluation concerns. Meanwhile, the economy’s exports plunged 8.3% year over year in July, massively falling short of analysts’ expectation of a 1.5% decline as well as the 2.8% drop-off recorded in June. Though a 1.3% fall in exports to the U.S. was not that alarming, exports plummeted 12.3% and 13% in the EU and Japan, respectively. These two regions are presently under QE policy and thus see relatively weak currencies against the greenback. This gave the Chinese policymakers a wake-up call that it is high time to devalue its currency, yuan, to maintain the export competitiveness. As a result, China undervalued its currency yen against the U.S. dollar by a historic amount, i.e., 100 bps on August 11. Yuan has now plunged to the 2012 levels. Per Reuters , China’s central bank fixed the midpoint for its currency at 6.2298 per dollar, down from 6.1162 seen on August 10. The bank also indicated that it was eyeing a currency devaluation of 2%. As per Barrons.com , the Chinese government viewed yuan as an extremely strong currency. Given the looming Fed policy normalization and its depreciating impact on a basket of currencies, any shift in yuan ‘from market expectations’ seems unreasonable. However, such an epic move in the Chinese currency market will definitely leave an impact across the globe. Below we highlight a few asset classes and their ETFs, which may be among the biggest movers. Currency Needless to say, the move will lead the Chinese currency ETF, the WisdomTree Chinese Yuan ETF (NYSEARCA: CYB ), to losses while the dollar ETF, the PowerShares DB USD Bull ETF (NYSEARCA: UUP ), will gain strength. The Aussie dollar lost about 1% following the announcement, putting Australia ETF, the CurrencyShares Australian Dollar Trust ETF (NYSEARCA: FXA ), at risk. Per Reuters, the Australian dollar is often regarded as a liquid proxy for the Chinese currency. China is a major trading partner of Australia and thus the currencies of the duo share a high correlation. Currencies like the Singapore dollar, South Korean won and Taiwan dollar will be stressed as these countries are manufacturing destinations and thus act as competitors to China on the export front. Market experts apprehend a currency war among these Asian tigers in the near future. Gold How much more pain will gold have to bear? The yellow metal already crossed its five-year low level on its way down hit by the dollar strength thanks to the impending Fed rate hike, a deflationary environment prevailing in most part of the developed world and reduced demand from the key consuming nation China because of its waning economy. Now, currency devaluation will likely curb the import demand of gold from China as a feebler currency will turn imports pricier. The SPDR Gold Trust ETF (NYSEARCA: GLD ) tracking the gold bullion will bear the brunt the most, while the impact will not be unnoticed by the gold mining ETF, the Market Vectors Gold Miners ETF (NYSEARCA: GDX ). Apart from gold, several industrial metals will likely see a negative pricing trend in the near term as the Chinese economy accounts for about half of the global consumption of the industrial commodities and is the second-biggest purchaser of oil. The iPath Dow Jones-UBS Nickel Total Return Sub-Index ETN (NYSEARCA: JJN ), the UBS E TRACS CMCI Industrial Metals Total Return ETN (NYSEARCA: UBM ), the ELEMENTS Rogers International Commodity Metal ETN (NYSEARCA: RJZ ) and the United States Copper Index ETF (NYSEARCA: CPER ) are some of the ETFs which might succumb to a slowdown. Equities As we already know that the South Korean and Taiwanese economies thrive on exports, these nations will now be losing on currency competitiveness to China. There are several South Korean companies, namely Samsung Electronics ( OTC:SSNLF ), Hyundai Motor ( OTC:HYMLF ) ( OTC:HYMTF ), LG Corp. and Daewoo, which have big export markets and Taiwan houses one of the largest semiconductor companies in the world – Taiwan Semiconductor. In short, these two countries’ stock markets will be hit by the yuan devaluation in a passive way. This puts the iShares MSCI South Korea Capped ETF (NYSEARCA: EWY ), the Horizons Korea KOSPI 200 ETF (NYSEARCA: HKOR ) as well as the iShares MSCI Taiwan ETF (NYSEARCA: EWT ) and the First Trust Taiwan AlphaDEX ETF (NASDAQ: FTW ) in focus. While this move might help some Chinese sectors and equities, investors should note that most of the Chinese equities ETFs are not hedged to the greenback and thus may see some downward pressure on U.S. exchanges. Some Chinese equities ETFs to watch in the coming days are the Market Vectors ChinaAMC SME-ChiNext ETF (NYSEARCA: CNXT ), the Market Vectors ChinaAMC A-Share ETF (NYSEARCA: PEK ), the iShares China Large-Cap ETF (NYSEARCA: FXI ) and the iShares MSCI China ETF (NYSEARCA: MCHI ). Original Post
The Uncertainty Around The Fed’s Liftoff Keeps GLD From Falling

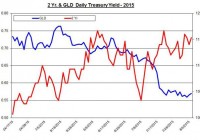
Summary The uncertainty around the possibility of a rate hike in the coming months benefits GLD. Nonetheless, a September rate hike is still on the table. Short-term treasury yields are adjusting for higher rates in the coming years. The non-farm payroll report came a bit short of market estimates with a gain of 215,000 jobs. Nevertheless, the SPDR Gold Trust ETF (NYSEARCA: GLD ) bounced back over the weekend and kept slowly rising at the beginning of the week. GLD could resume its descent, however, if the FOMC were to raise rates next month. But the market is still on the fence about the timing of the historic lift off. So September is still on the table? The market still seems confused about the Fed’s timing of the first rate decision. And the mixed signals we have received in recent weeks – from FOMC participating members such as James Bullard and Dennis Lockhart , who keep suggesting that a lift off is imminent, through the economic data, which for the most part, keep showing the U.S. economy is growing but not much faster than earlier this year, and the previous FOMC meeting , which had a dovish sentiment – haven’t made things any easier for the market’s estimates. Case in point, the implied probabilities for a September rate hike, which were nullified a few days ago, have gone back up to 54%. For December, the odds are 75%. Nonetheless, any delay in the first rate hike is likely to keep GLD from falling to a new low. Short-term rates are picking up Besides the implied probabilities derived from the bond market, the rates of short- and long-term rates also provide an interesting account of the changes in the demand for treasury bills. Specifically, the long-term yields (say for 10 years and higher) have actually come down in the past few weeks while short-term rates for 6 months to 3 years have risen. It seems that even though the market is slowly adjusting to the fact that low cash rates aren’t here to stay, the long-term rates, which are mostly driven by, besides the Fed’s short-term rates, inflation expectations and risks haven’t gone up. (click to enlarge) Source: U.S. Department of Treasury and Bloomberg This could be because the market considers lower inflation in the long run than it did in the past or that the risk in investing in U.S. treasury bills could rise while over the short run, the rise in yields is mostly related to cash rate hikes. When it comes to inflation expectations, they have gone up in the past few months, as you can see in the chart below: (click to enlarge) Source: Federal Reserve Bank of Cleveland Nonetheless, the 5-year and 10-year expectations are still below the Federal Reserve’s inflation target of 2%. Even Federal Reserve Vice Chairman Stanley Fischer recently pointed out that the current U.S. inflation is very low, mainly due to low commodities prices and that global deflationary trend “bothers” the Fed, even though it’s only one among several factors that impact the FOMC’s decisions about policy. Conversely, Lockhart suggested in a recent press conference that the first rate hike won’t depend on U.S. inflation – so even if inflation doesn’t reach the 2% mark anytime soon, which is a very fair assessment, liftoff is still a viable possibility next month. And who said there isn’t confusion in the markets about the Fed’s policy? For GLD, lower long-term yields could actually benefit its price, as it did in the past when yields plummeted to historic low levels. But this hasn’t been the case. Even though for gold, long-term yields are more likely to impact the direction of gold prices, the recent rally of short-term yields may have also contributed to the weakness in the gold market. (click to enlarge) Source: U.S. Department of Treasury and Bloomberg Moreover, the correlations among GLD and the U.S. treasury yields aren’t too strong with the strongest correlations for the short-term yields – 2-year bonds. In the past, the long-term treasury yields had a much stronger and significant correlation with GLD. Thus, the uncertainty around the Fed’s policy over the short term is a strong factor in moving both short-term yields and GLD. The JOLTS report will be released this week and will provide another indicator about the U.S. labor market – last month’s report showed a modest fall to 5.36 million job openings. Next week, the FOMC will release the minutes of the July meeting, which could provide a bit more guidance about the last rate decision and what’s up ahead especially considering it’s the last piece of information from the FOMC before the September meeting. The labor market showed another solid growth in jobs but didn’t beat expectations. The FOMC keeps the rate hike decision uncertain, which for now actually benefits GLD. As long as there remains a possibility of a rate hike later rather than sooner, GLD could, at best, slowly rise and at worse remain range bound. But as the U.S. labor continues to improve, the odds of a rate hike in September will rise – a scenario that could bring back down GLD. For more please see: ” Gold and Inflation – Is there a relation? ” Disclosure: I/we have no positions in any stocks mentioned, and no plans to initiate any positions within the next 72 hours. (More…) I wrote this article myself, and it expresses my own opinions. I am not receiving compensation for it (other than from Seeking Alpha). I have no business relationship with any company whose stock is mentioned in this article.

Southern Company: 4.8% Yield And Decades Of Dividends

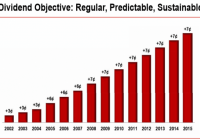
Summary Investors can expect 7.8% to 8.8% total returns from Southern Company. The company has an exceptionally long dividend history. Is Southern Company over indebted? Southern Company (NYSE: SO ) is a large cap utility that supplies electricity to 4.5 million customers in Georgia, Alabama, Mississippi, and Florida. What stands out about Southern Company is its stability and consistency. The company has paid dividends every quarter since 1948 . In addition, the company has not reduced its dividend as far back as I can find. My records stopped in 1982 – it’s been at least that long since the company has been forced to reduce its dividend payments. The image below shows its more recent dividend history: (click to enlarge) These are not small dividends either. Southern Company currently has a dividend yield of 4.8%. The company’s long history of dividend payments makes it a member of the Dividend Achievers Index. Click here to download a list of all 238 members of the Dividend Achievers Index . It’s not just Southern Company’s dividends that are stable. The company’s stock price exhibits low volatility as well. Southern Company’s 10-year average stock price standard deviation is just 16.9%. For comparison, the only other large cap stocks I’ve found with lower standard deviations over the last decade are Johnson & Johnson (NYSE: JNJ ) and Consolidated Edison (NYSE: ED ). If you are interested in high yields and stability with inflation-beating growth, then Southern Company makes a compelling investment to consider further. Business Overview Southern Company generates over 90% of its earnings from the heavily regulated utilities industry. The remaining income comes from competitive wholesale electricity sales. The image below shows the company’s current and “under-construction” portfolio of power assets. The company’s entire portfolio is spread across the Southern half of the United States – hence the name “Southern Company.” (click to enlarge) Growth Prospects Let’s be very clear: Southern Company is not a fast grower . The company has compounded earnings per share at 3.0% a year over the last decade. Dividends per share have grown slightly faster at 3.9% a year. The company currently has a payout ratio of 80%. As a result of Southern Company’s high payout ratio, investors should expect dividend growth in line with earnings per share growth going forward. One way that businesses with stable cash flows boost growth is through share repurchases. Reducing the number of shares increases earnings on a per share basis. Unfortunately, Southern Company regularly raises capital through share issuances . This dilutes current shareholder ownership and reduces earnings per share (all other things being equal). Over the last decade, Southern Company has increased its share count at 2.3% a year. Had Southern Company been able to finance its growth without increasing share count, its earnings per share growth rate would have been a more respectable 5.3% a year over the last decade. Fortunately, management does not plan to fund its current growth plans with more share issuances. The company’s financing plan ( in the image below ) aims to rely exclusively on debt through 2017. Simply halting share issuances will go a long way toward improving Southern Company’s growth. (click to enlarge) Southern Company showed earnings per share growth of 1.5% in its most recent quarter . Southern Company is expecting earnings per share growth of between 3% and 4% in fiscal 2015. This is also in line with management’s long-term earnings per share growth goals. Given the company’s history, growth of 3% to 4% a year seems likely. This earnings per per share growth, combined with the company’s current 4.8% dividend yield, gives investors in Southern Company expected returns of 7.8% to 8.8% a year. Current Troubling Issues Southern Company has experienced 2 recent setbacks , which have hurt earnings in the short-run. First, the company is building a coal gasification plant in Mississippi. The plant was originally expected to go online in May of 2014 but has been stalled due to ongoing construction delays. The plant is now expected to go online during the first half of 2016. This 2-year delay has already cost Southern Company over $1 billion. Secondly, Southern Company is also experiencing delays for the construction of its Vogtle nuclear plants. The completion date has already been delayed 18 months . Every month of delay will cost Southern Company an extra $40 million. The full 18-month delay is expected to cost over $700 million While troubling, these delays to not reflect long-term threats to Southern Company’s dominant position in the electric utility markets which it serves. Utilities form natural monopolies. They are highly regulated as well. These two factors make utility businesses in general – and Southern Company in particular – highly stable. Balance Sheet and Recessions Southern Company is heavily indebted, as most utilities are. The company has around $25 billion in debt. In addition, the company has another $1.2 billion in unfunded pension liabilities. On top of that, Southern Company has $1.3 billion in preferred stock as well. The company has $220 million in cash. The company has annual interest expenses and preferred dividends of around $870 million a year. Annual operating income is around $4 billion. While Southern Company has a large debt load, the company is not at risk of defaulting thanks to its large, stable cash flows. The company’s performance over the Great Recession of 2007 to 2009 gives an example of consistency of Southern Company’s earnings: 2007 earnings per share of $2.28 2008 earnings per share of $2.25 2009 earnings per share of $2.32 2010 earnings per share of $2.36 Final Thoughts It is very unlikely that Southern Company generates double-digit returns for investors going forward. Still, total returns of 7.8% to 8.8% a year, coupled with low risk and low volatility, make Southern Company an interesting choice for investors needing both safety and current income. The company’s high 4.8% dividend yield and extremely low stock price deviation give it an above-average rank among dividend stocks with long histories using The 8 Rules of Dividend Investing. Southern Company has a price-to-earnings ratio of 16.8 using adjusted earnings. The company is likely trading around fair value at this time given its decent total return prospects and high scores for stability. Disclosure: I/we have no positions in any stocks mentioned, and no plans to initiate any positions within the next 72 hours. (More…) I wrote this article myself, and it expresses my own opinions. I am not receiving compensation for it. I have no business relationship with any company whose stock is mentioned in this article.