Tag Archives: nyseawk

Aqua America: The Water Utility To Own

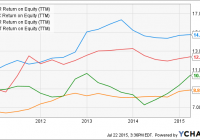
Summary Aqua America is currently overvalued relative to peers, but could be bought on dips or through the company’s DRIP. Focused on very high operational efficiency. Raised their dividend 23 years in a row. I typically shy away from highly regulated industries such as water utilities, however Aqua America (NYSE: WTR ) offers many benefits to a well-balanced portfolio. Aqua America is the country’s second largest publicly traded water and wastewater utility by market cap and serves roughly 3 million customers in the eastern United States, primarily Pennsylvania. As a company in the water utility industry, Aqua America is limited in their organic growth as their rate increases have to be approved by regulators. Therefore much of their top line growth has to come from acquisitions to add more customers. In the last 20 years Aqua America has made over 300 acquisitions . The trend towards consolidation will continue for many years due to the costs involved in operating and maintaining water and wastewater systems. The business can be run much more efficiently at scale so it is sensible that these systems be run by larger private companies than small municipal governments. Aqua America’s commitment to efficiency With top line growth limited to regulated rate increases and acquisitions it is incredibly important for utilities to manage costs efficiently and scale their businesses properly in order to provide investors adequate return. Aqua America has made many commitments to efficiency, large and small. They spent $329 million on infrastructure improvements in 2014 to improve reliability and reduce leakage. With operational cash flow and low cost debt, they plan spend another $1 billion on infrastructure improvements over the next three years. They also take pride in their use of solar energy, bi-fuel truck fleets, and efficient lighting systems to keep energy costs as low as possible. Using cash flow from operations margin (CFO divided by net sales) as a measure of efficiency, Aqua America easily trumps the other three largest publicly traded water utilities. Over the last three years Aqua America has had an average cash flow from operations margin of 48% , well above American Water Works Co. (NYSE: AWK ), American States Water Co. (NYSE: AWR ), and California Water Service Group (NYSE: CWT ), with three year averages of 33.7% , 28.5% , and 22.1% , respectively. Between 2010 and 2013 the company focused on a portfolio rationalization strategy to become more efficient. During this process the company divested in operations where there was little long term customer growth potential or they could not achieve acceptable operating results. These divestitures allowed the company to become more focused in markets in which they have already reached a critical mass of customers and have long term growth potential. This strategy helped the company grow their return on equity above levels seen in their peer group. WTR Return on Equity (NYSE: TTM ) data by YCharts Strategy results Since the early 1990’s, the growth by acquisition strategy has helped Aqua America more than quadruple its customer base. From 2005 to 2014, Aqua America raised their revenue and earnings per share at compounded annual growth rates of 5.1% and 9.7% , respectively. The successes have enabled the company to raise the dividend to shareholders in each of the last 23 years, including increases of greater than 5% per year in the last 16 years. Looking forward At the end of the second quarter Aqua America replaced its retiring CEO, Nick DeBenedictis, who had presided over the company’s growth for the last 23 years. Incoming CEO Christopher Franklin has been with the company for 22 years and was previously Chief Operating Officer, watching over all regulated operations. As a company veteran very knowledgeable of operations, Franklin should be able to transition smoothly and continue to bring excellent results. Through the end of the first quarter the company had already acquired water and wastewater systems in Illinois, Pennsylvania, Virginia, and New Jersey. With plans to acquire another 15 to 20 systems in 2015 the company is on their way to customer growth of 1.5 to 2.0% for the year, which would be their highest level since 2008. In addition to regulated operations, the company also has room to grow in non-regulated industries. The company has one subsidiary offering liquid waste disposal as well as protection and repair services for households and another subsidiary that provides non-utility water supply to firms in the natural gas drilling industry. Though these operations only accounted for 3% of company revenue in 2014, they have shown strong growth potential. Portfolio opportunity Currently Aqua America appears to be fairly valued on a P/E basis but slightly overvalued in an EV/EBITDA comparison to peers. Their current P/E ratio of just under 19 is about even with the S&P 500. However compared to the peers studied earlier, Aqua America appears to be overvalued as they trade at an enterprise value/EBITDA of 13.8 . AWK, AWR, and CWT trade at EV/EBITDA multiples of 10.5 , 10.5 , and 8.9 , respectively. I see opportunity to buy this company for the long term on the next large market dip or more preferably through the company’s dividend reinvestment program . Their dividend currently yields about 2.60%. As said earlier, management has been committed in recent years to raising the dividend rate, and I don’t see this changing any time soon. Enrolling in the dividend reinvestment program directly through the company’s transfer agent allows you to buy shares of the company at a 5% discount to market price on all dividends reinvested; another substantial bonus to holding this company. Disclosure: I/we have no positions in any stocks mentioned, but may initiate a long position in WTR over the next 72 hours. (More…) I wrote this article myself, and it expresses my own opinions. I am not receiving compensation for it (other than from Seeking Alpha). I have no business relationship with any company whose stock is mentioned in this article.

Using ESG Screens For Utilities Stock Selection: American Electric Power Comes Out Ahead

Summary AEP comes out as the top pick after fundamental analysis and ESG screening. AEP’s fundamental and ESG scores were impressive in comparison to the rest of the sector. Since August 2014, its stock has performed admirably. Environmental, social, and governance (ESG) screening strategies can find alpha in innovative companies. Utilities fit well into this analysis and screening methodology. Last July, while looking for an investment opportunity, I recalled New York City’s legendary summer blackouts. During those fateful evenings in August 1959, July 1977, and August 2003, the city’s electric utility, Con Edison, played a feature role in the events that were retold by patrons for decades. While Con Edison worked feverishly to restore power to the city, New Yorkers took off their shirts and wrung out their sweat-soaked handkerchiefs while sitting on their stoops, balconies, and porches waiting for a cool breeze from the East River. With this picture, I decided to explore the utilities sector for an investment opportunity. Utilities have been favored by investors for dividend yields and capital preservation. Many utilities are under-covered by securities analysts and as such, price discovery and liquidity are potentially hampered, creating potential long-term investment opportunities according to Target Rock Advisors, a socially responsible investing (SRI) consulting company focused on the utilities sector. I am an SRI champion so I began my sector analysis by applying an Environmental, Social, and Governance (ESG) screen. Afterwards, I look at fundamentals. Since I am investing for the long term and income, ESG screening is a sensible starting place. I used the Thomson Reuters Corporate Responsibility Ratings (TRCR) ESG Port for my first screen. The TRCR dataset allowed me to extract the U.S. utilities sector comprised of electric utilities, multiline utilities, natural gas utilities, and water & other utilities. My objective was to find the top performing utilities while applying an ESG tilt. The database is built to allow investment managers to select companies using a “best in class” measure, forgoing the alternative of ethical exclusions also called “negative screening”. This process presented me with the top ESG performers in the utilities sector. I retrieved 47 companies in all. Each company has four scores: an Environmental Score, a Social Score, a Corporate Governance score, and a composite ESG score which is the average of the three. The scores range from 1 to 100. Rather than simply ranking the companies by their composite ESG scores, I applied a weighted screen having greater leverage on the Social and Governance Pillars. Utilities are indubitably joined-up with environmental matters and actively comply with compulsory environmental regulations. To a large extent, utilities have recognized their environmental risks–so I reasoned that these risks have been priced into their stocks (with the exception of a “black swan” event). This relegated Environmental Scores to a lower weighting by my design. High Corporate Governance Scores are typically accepted as an indicator of strong corporate performance and lower risk since they are indicative of the company’s good management, strong board structure, as well as corporate charters and bylaws that are favorable to shareholders. Additionally, as a regulated industry, compulsory reporting assures transparency, another component of strong corporate governance scores. Clearly, “a strong governance rating would be a better long term indicator of stock market performance versus a strong environmental rating” according to Richard Rudden of Target Rock. Well managed companies have long term horizons that bode well for economic sustainability. A utility’s Social Score is perhaps the most revealing ESG indicator and the best place to look for an investment advantage, assuming that there is an accompanying strong corporate governance score. Social scores have key performance indicators for Employment Quality, Health & Safety, Training & Development, Diversity, Human Rights, Product Responsibility and Community Involvement. In Target Rock Advisor’s words, “Utilities have an abiding interest in supporting local and regional health and economic development, since those areas represent their core markets.” In effect, utilities are joined by the hip to the markets that they serve. Economic Analysis The final decision comes after a proper economic analysis. To do this I used MarketGrade.com’s StockGrader tool. StockGrader applies a fundamental analysis to companies and grades them in a range of 1 to 100. It uses technology to analyze a public company’s financial statement and presents the results in a user-friendly format. According to StockGrader, AEP distributed dividends uninterrupted for at least five years and based on the latest payout the stock was yielding 3.80%. The company was showing accelerating margin growth over the last three quarters and profits grew very strongly from the previous quarter compared to a year prior plus full year net income showed healthy gains from three years ago. Their latest report also showed a remarkable 20.68% increase from its total sales recorded during the same quarter last year. From a valuation perspective, the company’s current market value is only 1.56 times its tangible book value, which excludes intangible assets such as goodwill. This, according to StockGrader means investors are currently assigning very little value to the company’s ongoing business and that its future earnings growth when combined with AEP’s market cap of $25.53 billion (which is only 7.31 times larger than its latest quarterly net income plus depreciation), seems like an attractive valuation. My Analysis Steps Here is an outline of my analysis. 1. Create a portfolio of companies in the utilities sector with Thomson Reuters Corporate Responsibility Ratings (TRCR). 2. Screen for the top performers in the Social pillar with TRCR. Tag the top ten performers. 3. Screen for the top performers in the Governance pillar with TRCR. Tag the top ten performers. 4. Identify the companies that are in both top ten performer groups. This revealed the following companies: American Water Works (NYSE: AWK ) Xcel Energy (NYSE: XEL ) Exelon Corp. (NYSE: EXC ) American Electric Power (NYSE: AEP ) 5. Access StockGrader for economic ratings as a method of performing my fundamental analysis. 6. Select the company that presents the best combination of these metrics. Top Companies Scoring Table Company EN Rating SO Rating CG Rating ESG Rating ESG Rank Market Grader Rating Market Grader Action American Water Works Company Inc 63.4 66.2 73.7 67.8 86.3 49.7 Sell Xcel Energy Inc 70.0 70.7 72.9 71.2 91.4 43.8 Sell Exelon Corporation 70.6 78.0 71.8 73.4 94.4 37.0 Sell American Electric Power Company 77.3 73.5 71.7 74.2 95.0 55.5 Hold American Electric Power Company Inc. My analysis resulted in the choice of American Electric Power Company Inc. AEP has been recognized within corporate social responsibility circles as an example of a good corporate citizen. Its fundamentals were impressive in comparison to the rest of the sector and made for a good economic selection. Since August 2014, its stock has performed admirably. A chart of AEP follows. (click to enlarge)