Tag Archives: nysearcasplv

The Risks Of Selling The Rally

Summary Investors that were fortunate to buy into the hole in either August or September have now been rewarded with a double digit gain on most broad-based indices. If you had the tenacity or good luck to buy the dip, you may question the risks of overstaying your welcome on the upside. Below are some bullet points that may provide a road map to making this difficult decision a little easier to digest. Investors that were fortunate to buy into the hole in either August or September have now been rewarded with a double digit gain on most broad-based indices. What began with some skepticism as just a short-covering binge has now morphed into the notion of a full blown recovery. There is even quite a bit of debate on whether or not we could take out the prior all-time highs on the S&P 500 Index before the year is out. Of course, if you had the tenacity or good luck to buy the dip, you may question the risks of overstaying your welcome on the upside. Those that took a more active approach in loading up on stocks near the lows are likely just as leery of a blow off top that ends in a swift and pernicious drop. Below are some bullet points that may provide a road map to making this difficult decision a little easier to digest. Evaluate your time horizon and investment goals. If you are short-term trader with defined risk parameters, then taking off some of your long positions into this run higher may be a prudent decision. It will free up cash to evaluate other opportunities and offer the flexibility to deploy capital when needed. Conversely, long-term investors may not be as concerned with these daily machinations and are willing to ride out additional volatility in order to stick with their plan. Here is a short guide to some of the key differences between being an investor and a trader . Consider making changes in small increments. If you took an above-average risk by loading up on stocks at the lows, then you have more flexibility to bank profits on the way higher. That may include breaking trades up into two or three pieces in order to slowly reduce your stock allocation over time. That way you can still participate in additional upside momentum if the market continues on the current course, but don’t have as much to lose if it turns lower. Don’t count on timing the market perfectly. There was a risk of buying on the way down that the market continues falling even further and compounds your losses. Similarly, there is an even greater risk that selling on the way up will leave you underinvested as the market continues to march higher. No one knows exactly where and when inflection points will form. Hanging on to some token long exposure may allow you to avoid the FOMO (fear of missing out) syndrome that leads to poor decision making at inopportune times. Analyze the risk profile of your exposure. If you loaded up on high beta sectors of the market such as technology or consumer discretionary stocks, it may be prudent to switch to a more defensive approach . That could include a low volatility index such as the PowerShares S&P 500 Low Volatility Portfolio (NYSEARCA: SPLV ) or individual sectors exhibiting less relative price sensitivity. That way you are still able to participate in some measure of upside potential with the intent of reducing downside risk. The Bottom Line There is always an opportunity cost when you make a change to your portfolio that your intended actions lead to more harm than good. Nevertheless, with a well-thought out game plan and sound portfolio management principles, you can enhance the odds of a favorable outcome.

The Low Volatility Anomaly: Risk Parity

Summary This series offers an expansive look at the Low Volatility Anomaly, or why lower risk securities have historically produced stronger risk-adjusted returns than higher risk securities or the broader market. After examining the historical evidence of the outperformance of lower volatility stocks and bonds relative to their higher risk comps, this article examines a cross-market strategy. The long-run success of risk parity investing is closely linked to our previously discussed Leverage Aversion Hypothesis. In previous articles in this series, I have demonstrated the presence of the Low Volatility Anomaly in both the equity and fixed income markets. In the introductory article to this series , I demonstrated that a low volatility bent (NYSEARCA: SPLV ) to the broader equity market has outperformed both the broader market (NYSEARCA: SPY ) and high beta stocks (NYSEARCA: SPHB ) on both an absolute and risk-adjusted basis over the last quarter century. In the last article in this series , I demonstrated that lower levered BB rated bonds have produced higher absolute returns than higher levered single-B and CCC-rated bonds historically, as the higher yields on the lower rated securities failed to make up for their higher realized default rate. Our empirical evidence thus far has examined the Low Volatility Anomaly within distinct asset classes. This article examines a potential application across asset classes. Risk Parity A 2012 research paper by Clifford Asness, Andrea Frazzini, and Lasse H. Pedersen, ” Leverage Aversion and Risk Parity ” demonstrates that in an investment landscape characterized by, at a minimum, declining incremental returns for higher risk assets, then an approach to asset allocation, risk parity investing, that seeks to diversify in terms of risk and not dollars is preferable. To diversify by risk, more money is invested in low-risk/low volatility assets than in high risk/high beta assets, and leverage is applied to low risk assets to increase both expected returns and risk to its desired level. (If this sounds familiar to the aforementioned ” Betting Against Beta ” analysis, note the overlap in two of the authors.) In their study with data dating to 1926 (see below), the authors demonstrated that a portfolio that targets an equal risk allocation between bonds and stocks meaningfully outperforms 1) U.S. stocks and bonds weighted by total market capitalization, and 2) a portfolio rebalanced monthly to maintain a fixed 60%/40% stock/bond weighting. A preference for risk parity investing necessarily implies expected stock returns continue to produce an insufficiently high equity risk premium as was witnessed by the underperformance of the equity market relative to levered fixed income in the historical sample depicted above. The ballyhooed equity risk premium ( Mehra and Prescott 1985 ), like the risk premium attributable to high beta stocks, is negative in this data over this time horizon featuring multiple business cycles. This phenomenon has given rise to this notion of risk parity investing, a method of diversifying by risk rather than dollars in equities and bonds. This of course runs counter to the traditional notion of holding the market portfolio levered according to the investor’s risk profile instilled by the Capital Asset Pricing Model (CAPM), the model we have been exposing throughout this series. Our first hypothesis for the presence of the Low Volatility Anomaly detailed in this series was the Leverage Aversion Hypothesis . If higher risk-adjusted returns can be made through leveraged fixed income than holding un-levered equities, then risk parity can be viewed as another form of exploitation of the Low Volatility Anomaly. Disclaimer My articles may contain statements and projections that are forward-looking in nature, and therefore, inherently subject to numerous risks, uncertainties and assumptions. While my articles focus on generating long-term risk-adjusted returns, investment decisions necessarily involve the risk of loss of principal. Individual investor circumstances vary significantly, and information gleaned from my articles should be applied to your own unique investment situation, objectives, risk tolerance, and investment horizon. Disclosure: I am/we are long SPLV, SPY. (More…) I wrote this article myself, and it expresses my own opinions. I am not receiving compensation for it (other than from Seeking Alpha). I have no business relationship with any company whose stock is mentioned in this article.

Low Volatility Anomaly: Buffett’s Alpha Example

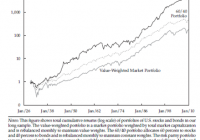
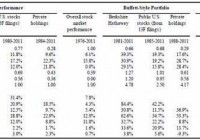
Summary This series offers an expansive look at the Low Volatility Anomaly, or why lower risk stocks have historically produced stronger risk-adjusted returns than higher risk stocks or the broader market. This article offers empirical evidence that one of the most successful investment minds of a generation has capitalized on this anomaly. By adding financial leverage to lower risk businesses, Berkshire Hathaway has generated higher risk-adjusted returns historically. Given the long-run structural alpha generated by low volatility strategies, I wanted to dedicate a more detailed discussion of the efficacy of this style of investing for Seeking Alpha readers. In recent articles, I have provided readers a detailed theoretical underpinning of the strategy. In this article and subsequent pieces, I am going to provide empirical evidence across markets that depicts the success of a low volatility bent. Empirical Evidence of the Low Volatility Anomaly Since the evolution of the Capital Asset Pricing Model (CAPM) in the early 1960s, it has been axiomatic in modern finance that expected returns are a function of an asset’s systematic risk, or beta, when the asset is added to a well-diversified portfolio. As discussed throughout this series thus far, the simplifying assumptions underlying CAPM provide frictions between model and market. These conventions underlying CAPM include that markets are wholly efficient, investors can lend and borrow unlimited amounts at the risk-free rate, trade fee of transaction costs and tax implications, and that the variance of returns is an adequate measure of risk in a world where asset returns are not normally distributed. Despite these shortcomings, the general CAPM framework has largely become broadly embedded in capital budgeting and, in part, market expectations. The presentation of empirical evidence on the Low Volatility Anomaly is greatly strengthened when you can demonstrate its role in the success of one of the greatest investors of our time. In 2013, Andrea Frazzini, David Kabiller, and Lasse Pedersen, each affiliated with hedge fund AQR Capital Management, published ” Buffett’s Alpha “, which deconstructed the return profile of Berkshire Hathaway (NYSE: BRK.A ) (NYSE: BRK.B ). From their analysis, the authors found: “the general tendency of high-quality, safe, and cheap stocks to outperform can explain much of Buffett’s performance and controlling for these factors makes Buffett’s alpha statistically insignificant.” That is a powerful statement. In a set-up to their attention-grabbing assertion, the authors demonstrated that of all stocks that traded for more than 30 years between 1926 and 2011, Berkshire Hathaway had the highest Sharpe Ratio. Buffett also magnified these risk-adjusted excess returns through the deployment of leverage estimated by the authors to be at a level of 1.6 to 1 on average. The leverage came both in the form of borrowings, which benefited from Berkshire Hathaway’s very high quality credit rating, and through float from his insurance subsidiaries. To demonstrate that Buffet’s tremendous performance was a function of this tendency to buy low risk stocks and employ conservative levels of investment leverage, the authors created tracking portfolios to mimic Buffett’s market exposure and active stock-selection themes, leveraged to the same active risk as Berkshire Hathaway. (click to enlarge) The Buffett-tracking portfolio performs comparably to the best-in-class performance of Berkshire Hathaway, demonstrating that Buffett is less a sage stock picker than a principled practitioner who has long understood the Low Volatility Anomaly and who had an investment vehicle that allowed him to avoid costly liquidations in times of stress. Note that Buffett’s average beta of his public stock holdings was just 0.77. In addition to the impressive long-run alpha demonstrated by Buffett’s leveraging of low volatility assets, another glaring failure of CAPM can be seen in the returns of the S&P 500 Low Volatility Index and the S&P 500 High Beta Index. These two indices form portfolios of the one hundred highest and lowest volatility stocks in the S&P 500 Index based on the standard deviation of price changes of the trailing 252 trading days. The indices are then rebalanced quarterly. The performance of these strategies was backtested to 1990, and demonstrates that returns would have been directionally opposite of what would be predicted by CAPM with low volatility stocks (replicated by the PowerShares S&P 500 Low Volatility Portfolio ETF (NYSEARCA: SPLV )) strongly outperforming high beta stocks (replicated by the PowerShares S&P 500 High Beta Portfolio ETF (NYSEARCA: SPHB )). (click to enlarge) Source: Standard and Poor’s; Bloomberg Joining these two examples, Buffett’s recent notable purchases have conformed to the idea of levering low volatility equities. When Berkshire Hathaway and 3G Capital combined to purchase H.J. Heinz in February 2013 , Heinz was the fifteenth largest constituent in the S&P 500 Low Volatility Index, putting the company in the 97th percentile of the S&P 500 in terms of trailing realized volatility. Buffett’s initial investment included an $8B preferred stake with a high fixed coupon, further dampening the volatility of the cash flow returns his enterprise received as part of the deal. The Berkshire/3G Capital combination would further expand their bet on the low beta packaged food sector in March 2015 with the purchase of a controlling stake in Kraft Foods Group (NASDAQ: KHC ). When Berkshire Hathaway’s Mid-American Energy unit purchased NV Energy in June of 2013 , the stock had a trailing twelve month beta of 0.73 and electric utilities were the largest individual sector weighting of the S&P 500 Low Volatility Index. When Berkshire’s utility unit had made an early purchase of Pacificorp in 2006, it was reported in Electric Utility Week that Buffett told Oregon regulators that owning utilities was “not a way to get rich – it’s a way to stay rich.” This quote came in the two years following Texas Pacific’s failed bid for Oregon’s Portland General Electric (NYSE: POR ) and KKR’s nixed acquisition of Arizona’s Unisource ( OTCPK:USRC ). Regulators at the time were concerned that these private equity firms would purchase the utility holding companies with excessive financing, the cost of which could be explicitly borne by customers in the form of higher rates and implicitly through backlogged maintenance, as capital expenditures were crowded out by debt service payments. With the notable exception of the disastrous TXU leveraged buyout in 2007, the industry has largely eschewed large scale leveraging transactions in favor of incremental releveraging through conservatively financed share repurchase plans and above market dividend rates. With regulated returns on equity, utilities generate stable and predictable cash flows for strong operators, making Buffett’s desire to lever the cash flow streams of these companies highly consistent with his long established track record of buying stable businesses. Warren Buffett’s tremendous long-run performance is in large part attributable to his early understanding of the relative outperformance of lower risk and stable businesses. In my next article in this series, I will demonstrate a way to capitalize on the Low Volatility Anomaly in the fixed income market. Disclaimer My articles may contain statements and projections that are forward-looking in nature, and therefore inherently subject to numerous risks, uncertainties and assumptions. While my articles focus on generating long-term risk-adjusted returns, investment decisions necessarily involve the risk of loss of principal. Individual investor circumstances vary significantly, and information gleaned from my articles should be applied to your own unique investment situation, objectives, risk tolerance, and investment horizon. Disclosure: I am/we are long SPLV. (More…) I wrote this article myself, and it expresses my own opinions. I am not receiving compensation for it (other than from Seeking Alpha). I have no business relationship with any company whose stock is mentioned in this article.