Tag Archives: nreum

Vanguard 500 Index Fund: A Mutual Fund Anyone Can Appreciate In Their 401k

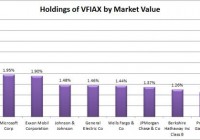
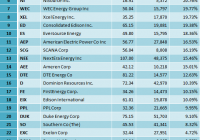
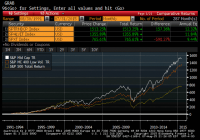
Summary VFIAX is a mutual fund designed to track the S&P 500 with a lower expense ratio than SPY. The mutual fund is a great holding for investors wanting to replicate the performance of “the market” without getting devoured by fees. This is a solid option for the retirement account. The Vanguard 500 Index Fund Admiral Shares (MUTF: VFIAX ) offer investors an excellent way to handle their investments. While I’m a huge fan of using ETFs in the construction of a portfolio, Vanguard is offering some mutual funds with very compelling expense ratios. The nice thing about these mutual funds is that investors are able to buy fractional shares which are excellent for dollar cost averaging. Volatility The standard deviation of returns (monthly) shows very similar levels of volatility to the S&P 500 index as tracked by (NYSEARCA: SPY ). Correlation is also running around 99.9%. The holdings are very similar, but these shares are offering a lower expense ratio and the ability to use dollar cost averaging very effectively. Expense Ratio The mutual fund is posting .05% for an expense ratio. There is really nothing to complain about here. It beats SPY and it beats most mutual funds and ETFs in existence. Largest Holdings The diversification within the fund is good. There are not as many holdings as the whole market index funds that I often prefer, but all around this is a very solid fund. (click to enlarge) Risk Factors The biggest issue for VFIAX is the risk that the S&P 500 is getting fairly expensive on many fundamental levels. For instance, the P/E ratio on the index is fairly high (running over 20). The high P/E ratio comes at a time when corporate profits after taxes are also very high relative to GDP. My concern is about the valuation level of the market. When it comes to ways to buy the market, VFIAX is one of the best funds to use for the task. When it comes to risk assessment, I’m not sure I’d go with Vanguard’s scale, shown below: Vanguard has a tendency to mark any primarily equity investment as being fairly high risk. Relative to other equity investments, the risk level here is very reasonable. The fund still scores high on risk for Vanguard’s scale because they are comparing it to other funds stuffed with lower risk securities than equity. Compared to a very short term high credit quality bond fund, I have to agree that VFIAX has substantially more risk. Compared to the broad universe of equity investments, VFIAX is doing a solid job of holding a diversified portfolio of large capitalization companies with solid histories. Other Things to Know Minimum investments for opening a position were $10,000 according to the Vanguard website. After that additional purchases could be in increments as small as $1. This is a solid fund for dollar cost averaging. Based on my macroeconomic views, I would want to use a fund like VFIAX for equity exposure but I also believing hold some cash on hand is wise given the potential for a reduction in equity prices. When it comes to using mutual funds, I think the best way to deal with them is to dollar cost average in. I like using ETFs to adjust my portfolio exposure but the mutual funds can be set as a “set it and forget it” investment vehicle. When making a meaningful contribution to a fund month after month without checking up on it, it would be wise to make sure the fund is reasonably diversified and that the expense ratios are low. The Vanguard 500 Index Fund Admiral Shares easily sail through both of those tests. Conclusion While I am concerned that market valuations are a little on the high side, I’m still investing each month. I choose to hold more in cash than I would if the market looked cheaper, but I still see dollar cost averaging into the right funds as a viable long term strategy. The biggest challenge for investors is to resist the urge to pull back when the market falls. We should all expect that the stock market will fall within the next 30 years. When those drops happen, investors need to be able to stomach stepping into the market to buy. Since those times are often very scary, one solution is to set up automatic purchases for a fund like VFIAX. To avoid overthinking things, I keep automatic contributions running as a baseline for investing. I use my other accounts to make additional purchases. If your employer sponsored plan offers VFIAX, it is a mutual fund worthy of consideration. Figure out your own risk tolerance and determine if the equity exposure is right for you. The biggest potential mistake an investor could make with buying VFIAX would be to put 75%+ of their portfolio in the fund when they are only a couple years from retirement and will be required to sell off shares to take distributions. So long as the total level of risk is appropriate for the investors, this is a great fund to use as the core of a passive retirement portfolio. Disclosure: I/we have no positions in any stocks mentioned, and no plans to initiate any positions within the next 72 hours. (More…) I wrote this article myself, and it expresses my own opinions. I am not receiving compensation for it (other than from Seeking Alpha). I have no business relationship with any company whose stock is mentioned in this article. Additional disclosure: Information in this article represents the opinion of the analyst. All statements are represented as opinions, rather than facts, and should not be construed as advice to buy or sell a security. Ratings of “outperform” and “underperform” reflect the analyst’s estimation of a divergence between the market value for a security and the price that would be appropriate given the potential for risks and returns relative to other securities. The analyst does not know your particular objectives for returns or constraints upon investing. All investors are encouraged to do their own research before making any investment decision. Information is regularly obtained from Yahoo Finance, Google Finance, and SEC Database. If Yahoo, Google, or the SEC database contained faulty or old information it could be incorporated into my analysis.

Best S&P 500 Utility Stocks According To A Winning Ranking System: A Look At Exelon

Summary Ranking the top twenty S&P 500 utility stocks according to a winning ranking system. Explanation and back-testing of the “ValueSheet” ranking system. Description and a buy recommendation for the first-ranked stock of the system: Exelon Corporation (EXC). S&P 500 utility stocks have given, on average, a similar return to that of the S&P 500 index over the last year. The average return of the 29 S&P 500 utility stocks that are included in the S&P 500 index (included dividends) in the last 52 weeks has been 10.51%, while the S&P 500 index has returned 9.77%. The table below shows all S&P 500 utility companies, ranked according to their 52 weeks return. A Ranking system sorts stocks from best to worst based on a set of weighted factors. Portfolio123 has a ranking system which allows the user to create complex formulas according to many different criteria. They also have highly useful several groups of pre-built ranking systems, I used one of them the “ValueSheet” in this article. The “ValueSheet” ranking system is quite complex, and it is taking into account many factors like; valuation ratios, growth rates, profitability ratios, financial strength, asset utilization, technical rank, industry rank, and industry leadership, as shown in Portfolio123’s chart below. In order to find out how such a ranking formula would have performed during the last 16 years, I ran a back-test, which is available by the Portfolio123’s screener. For the back-test, I took all the 6,651 stocks in the Portfolio123’s database. The back-test results are shown in the chart below. For the back-test, I divided the 6,651 companies into twenty groups according to their ranking. The chart clearly shows that the average annual return has a very significant positive correlation to the “ValueSheet” rank. The highest ranked group with the ranking score of 95-100, which is shown by the light blue column in the chart, has given by far the best return, an average annual return of about 18%, while the average annual return of the S&P 500 index during the same period was about 3.5% (the red column at the left part of the chart). Also, the second and the third group (scored: 90-95 and 85-90) have given superior returns. This brings me to the conclusion that the ranking system is very useful. After running the “ValueSheet” ranking system on all S&P 500 utility stocks on August 09, I discovered the twenty best stocks, which are shown in the table below. In this article, I will focus on the first-ranked stock; Exelon Corporation (NYSE: EXC ). (click to enlarge) On July 29, Exelon reported its second quarter 2015 results and narrowed its full-year operating earnings guidance to $2.35 to $2.55 per share. Exelon achieved earnings above its guidance range in the quarter, led by a strong financial performance at Constellation. The company beat EPS expectations in the last quarter by $0.05 (9.3%). The major drivers for the beat were reduced outages at ExGen’s nuclear plants and lower uncollectibles at Baltimore Gas & Electric. Revenue grew 5.1% to $6.51 billion in the period. Exelon showed earnings per share surprise in its last two-quarters after missing estimates in the previous quarter, as shown in the table below. Source: Yahoo Finance Despite low power prices and challenging market conditions in the wholesale power markets, I see healthy growth prospects for the company. The proposed all-cash acquisition, pending approvals, of Pepco (NYSE: POM ), will help to boost Exelon’s earnings growth rate. The merger continues to be conditioned upon approval by the Public Service Commission of the District of Columbia. Exelon expects the merger to be completed in the third quarter of 2015. On the regulated side, the forthcoming Pepco merger should bring opportunities for investment and operational improvement, as well as an additional regulated earnings stream to support the dividend. Also, the coming industry coal plant retirements will lower future reserve margins and would lead to higher electricity prices. In another development, the company plans, in September, to decide what nuclear plant will be retired due to uneconomic operational conditions. Exelon continues to evaluate the viability of three of its nuclear plants in Illinois (Byron, Quad Cities, and Clinton) given that the Illinois legislative session ended without a resolution on the low carbon portfolio. Valuation EXC’s stock has underperformed the market in the last few years. The stock is down 12.5% year-to-date while the S&P 500 index has increased 0.9%, and the Nasdaq Composite Index has gained 6.5%. Moreover, since the beginning of 2013, EXC’s stock has gained only 9.1% while the S&P 500 index has increased 45.7%, and the Nasdaq Composite Index has risen 67%. However, In my opinion, EXC’s stock is a clear value with the stock having faded more than its fundamentals and key catalysts. (click to enlarge) Chart: TradeStation Group, Inc. Exelon’s valuation metrics are excellent, the trailing P/E is very low at 11.97, the forward P/E is low at 13.40, and its price-to-sales ratio is also very low at 0.95. Furthermore, its Enterprise Value/EBITDA ratio is very low at 6.76, the lowest among all S&P 500 utility stocks. Source: Portfolio123 Exelon is paying a generous dividend. The forward annual dividend yield is pretty high at 3.82% and the payout ratio is at 45.8%. However, the annual rate of dividend growth over the past five years was negative at -10%. Summary Exelon delivered better than expected second quarter results and narrowed its full-year operating earnings guidance to $2.35 to $2.55 per share. Exelon achieved earnings above its guidance range in the quarter, led by a strong financial performance at Constellation. Despite low power prices and challenging market conditions in the wholesale power markets, I see healthy growth prospects for the company. The proposed all-cash acquisition, pending approvals, of Pepco, will help to boost Exelon’s earnings growth rate. Exelon has compelling valuation; its EV/EBITDA ratio of 6.76 is the lowest among all S&P 500 utility stocks. In my view, the recent retreat in its price offers an excellent opportunity to buy the stock at a cheap price. Disclosure: I/we have no positions in any stocks mentioned, and no plans to initiate any positions within the next 72 hours. (More…) I wrote this article myself, and it expresses my own opinions. I am not receiving compensation for it (other than from Seeking Alpha). I have no business relationship with any company whose stock is mentioned in this article.

The Low Volatility Anomaly: Mid Caps

The Low Volatility Anomaly describes portfolios of lower volatility securities that have produced higher risk-adjusted returns than higher volatility securities historically. This article provides additional evidence for Low Volatility strategies by showing the factor’s success in mid-cap stocks. Provides historical comparison of returns between low volatility mid cap stocks versus broad mid cap indices and the benchmark large cap index. Thus far in this series, our most oft used description of the Low Volatility Anomaly in equity markets has been depicted through the use of a factor tilt on a large cap index. In the introductory article to this series on Low Volatility Investing, I plotted the cumulative total return profile (including reinvested dividends) of the S&P 500 (NYSEARCA: SPY ), the S&P 500 Low Volatility Index (NYSEARCA: SPLV ), and the S&P 500 High Beta Index (NYSEARCA: SPHB ) over the past twenty-five years. In an article last week , I showed that the Low Volatility Anomaly extends to small cap stocks as well as the S&P Smallcap 600 Low Volatility Index has also outperformed the broader S&P Smallcap 600 over the last twenty years, producing annual total returns of nearly 14% per annum. The volatility-tilted indices for both the small and large cap indices are comprised of the twenty percent of index constituents with the lowest (highest) volatility within the S&P 500 based on daily price variability over the trailing one year, rebalanced quarterly, and weighted by inverse (direct) volatility. The low volatility tilt of both the small and large cap indices produced both higher absolute returns and much lower variability of returns than the broader market gauges. This article will answer the question of whether such a factor tilt delivers alpha in the space in-between – the mid-cap stock market. Fortunately for our examination, Standard & Poor’s has also developed the S&P MidCap 400 Low Volatility Index . Similar to the S&P 500 Low Volatility Index, this benchmark tracks the twenty percent of the S&P MidCap 400 (eighty stocks) with the lowest realized volatility over the past year, weighted by an inverse of that volatility, and then rebalanced quarterly. While the index was launched in September 2012, Standard & Poor’s has back-tested data for over twenty years. Below is a graph of the cumulative total return of the S&P MidCap 400 Low Volatility Index, the S&P MidCap 400 Index, and the S&P 500. (click to enlarge) Source: Standard and Poor’s; Bloomberg As you can see above, the S&P MidCap 400 Index (white line; replicated through the ETF MDY ) readily bests the S&P 500 (yellow line). This outperformance is consistent with my article on 5 Ways to Beat the Market that demonstrated the structural alpha available through the size factor, which has been well documented in academic research (F ama & French, 1992 ). Some readers have also contended that the outperformance from Equal Weighting, which was also one of my “5 Ways ” is attributable to the size factor as well and more reminiscent of a mid-cap strategy given the lower average capitalization of equally weighting versus traditional capitalization weighting, but I contend that the contrarian re-balancing also contributes to the alpha-generative nature of that strategy. Whatever the source of the structural alpha, mid-caps have outperformed large-caps over long-time intervals. Low Volatility mid-caps have outperformed the broad mid-cap index on a risk-adjusted basis, but not on an absolute basis like the Small and Large Cap strategies. In tabular form, one can readily see that each of the small cap, mid cap, and large cap Low Volatility indices produce higher risk-adjusted returns with lower variability of returns than the broader market gauges from which they are constructed. The lower downside in the market selloff in 2008 greatly contributes to the lower variability of the Low Volatility indices. (click to enlarge) The PowerShares S&P MidCap Low Volatility Portfolio (NYSEARCA: XMLV ) seeks to replicate the performance of the S&P MidCap 400 Low Volatility Index with a 0.25% expense ratio. Like many of the Low Volatility ETFs, XMLV is a post-crisis innovation with a track record dating only back to February 2013. The ETF has only $100M of AUM, and thirty-day average volume of only 14,600 shares, similar AUM to the SmallCap Low Volatility ETF (NYSEARCA: XSLV ), but about 2/3 of the trading volume. Again similar to the Small Cap Low Volatility Index, I would be remiss if I did not mention that financials currently account for nearly half of the fund weighting (REITs 27.3%, Insurance 16.6%, Banks 3.8%). As I covered in a recent comparison between the PowerShares S&P Low Volatility ETF versus the iShares MSCI USA Minimum Volatility ETF (NYSEARCA: USMV ), industry concentrations in the S&P indices are uncapped, unlike the MSCI versions, and this lack of constraints has historically led to risk-adjusted outperformance and more variable industry concentrations over time. A reader of my article on Small Cap Low Volatility contended that they disfavored these funds because of the potential higher sensitivity to higher rates given the financial bent. Rates are moderately higher in 2015, and XMLV has delivered market-beating returns. I would point out that if higher rates lead to higher return volatility, then these stocks will be attributed lower weights or excluded from the fund at the quarterly rebalance date. As described in now fourteen recent articles on the Low Volatility Anomaly, I am a believer in the relative risk-adjusted outperformance of low volatility strategies. While Mid-Cap Low Volatility did not deliver the absolute outperformance versus the Mid Cap Index over the historical sample period, it still strongly outpeformed on a risk-adjusted basis. Versus the S&P 500, which many use as their benchmark, MidCap Low Volatility still delivered 3% per annum of outperformance with less than three-quarters of the return volatility. I am also a believer in the long-run outperformance available through the size factor that favors smaller and mid-capitalization stocks. Resultantly, I am evaluating an entry into a modest position to XMLV to provide some additional diversification to the Low Volatility portion of my long-term portfolio and will monitor the efficacy of this ETF vehicle as it matures. Disclaimer: My articles may contain statements and projections that are forward-looking in nature, and therefore inherently subject to numerous risks, uncertainties and assumptions. While my articles focus on generating long-term risk-adjusted returns, investment decisions necessarily involve the risk of loss of principal. Individual investor circumstances vary significantly, and information gleaned from my articles should be applied to your own unique investment situation, objectives, risk tolerance, and investment horizon Disclosure: I am/we are long SPY, SPLV, XSLV. (More…) I wrote this article myself, and it expresses my own opinions. I am not receiving compensation for it (other than from Seeking Alpha). I have no business relationship with any company whose stock is mentioned in this article.